


You wrote 40 replies last week. Three of them grew your account. The other 37 were noise. The problem? You have no idea which three — so next week you repeat all 40, guessing.
That is the gap X reply analytics fills. Most creators judge a reply by its like count, which is the one number that barely matters. The metrics that predict growth — reply impressions, profile visits, and follows — sit in a different part of X, and X never stitches them together for you.
Quick answer: X reply analytics means tracking a reply through the funnel that actually creates followers — impressions → profile visits → follows — instead of counting likes. X's native dashboard shows post-level data but never tells you which specific reply earned a follow. You close that gap with a simple scorecard.
This guide shows you exactly what to measure, what X's own analytics reveals versus hides in 2026, what a "good" reply engagement rate looks like, and a 15-minute weekly audit you can run today.
Why X reply analytics is not the same as post analytics#
Post analytics answers "did people like my tweet?" Reply analytics answers "did borrowing someone else's audience earn me a follower?" Those are different questions with different scoreboards, and using post logic on replies is why most reply strategies stall.
When you post, the audience is your followers. When you reply, the audience is a stranger's followers who have never heard of you. A like on your post is a warm nod. A like on your reply is almost meaningless — the currency that matters is whether a stranger clicked your name and followed.
So the winning reply metric is not engagement on the reply itself. It is the downstream action: the profile visit and the follow. A reply with 12 likes and zero profile visits lost. A reply with 2 likes and 30 profile visits won. If you only watch likes, you optimize for the wrong behavior and wonder why your follower count flatlines.
Post analytics | Reply analytics | |
|---|---|---|
Audience | Your followers | A stranger's followers |
Success signal | Likes, reposts, saves | Profile visits, new follows |
A "good" like count means | Your content resonated | Almost nothing on its own |
The metric that predicts growth | Reposts (reach) | Profile-visit rate (discovery) |
What X shows you directly | Post activity | No per-reply attribution |
The Reply-to-Follow Funnel: the 3 metrics that predict growth#
Every follower you earn from a reply passes through the same three-step chain. Name it, measure each step, and you can see exactly where a reply leaks. Call it the Reply-to-Follow Funnel.
Step one is reply impressions — how many people saw your reply. Step two is profile visits — how many of them were curious enough to click your name. Step three is follows — how many of those visitors stuck. Each step has its own failure mode, and each points to a different fix.
If impressions are low, your reply landed too late or under a post with no reach — a targeting problem. If impressions are high but profile visits are low, your reply was seen but forgettable — a content problem. If profile visits are high but follows are low, your profile is the leak, not your replies — a positioning problem. One funnel, three very different diagnoses.
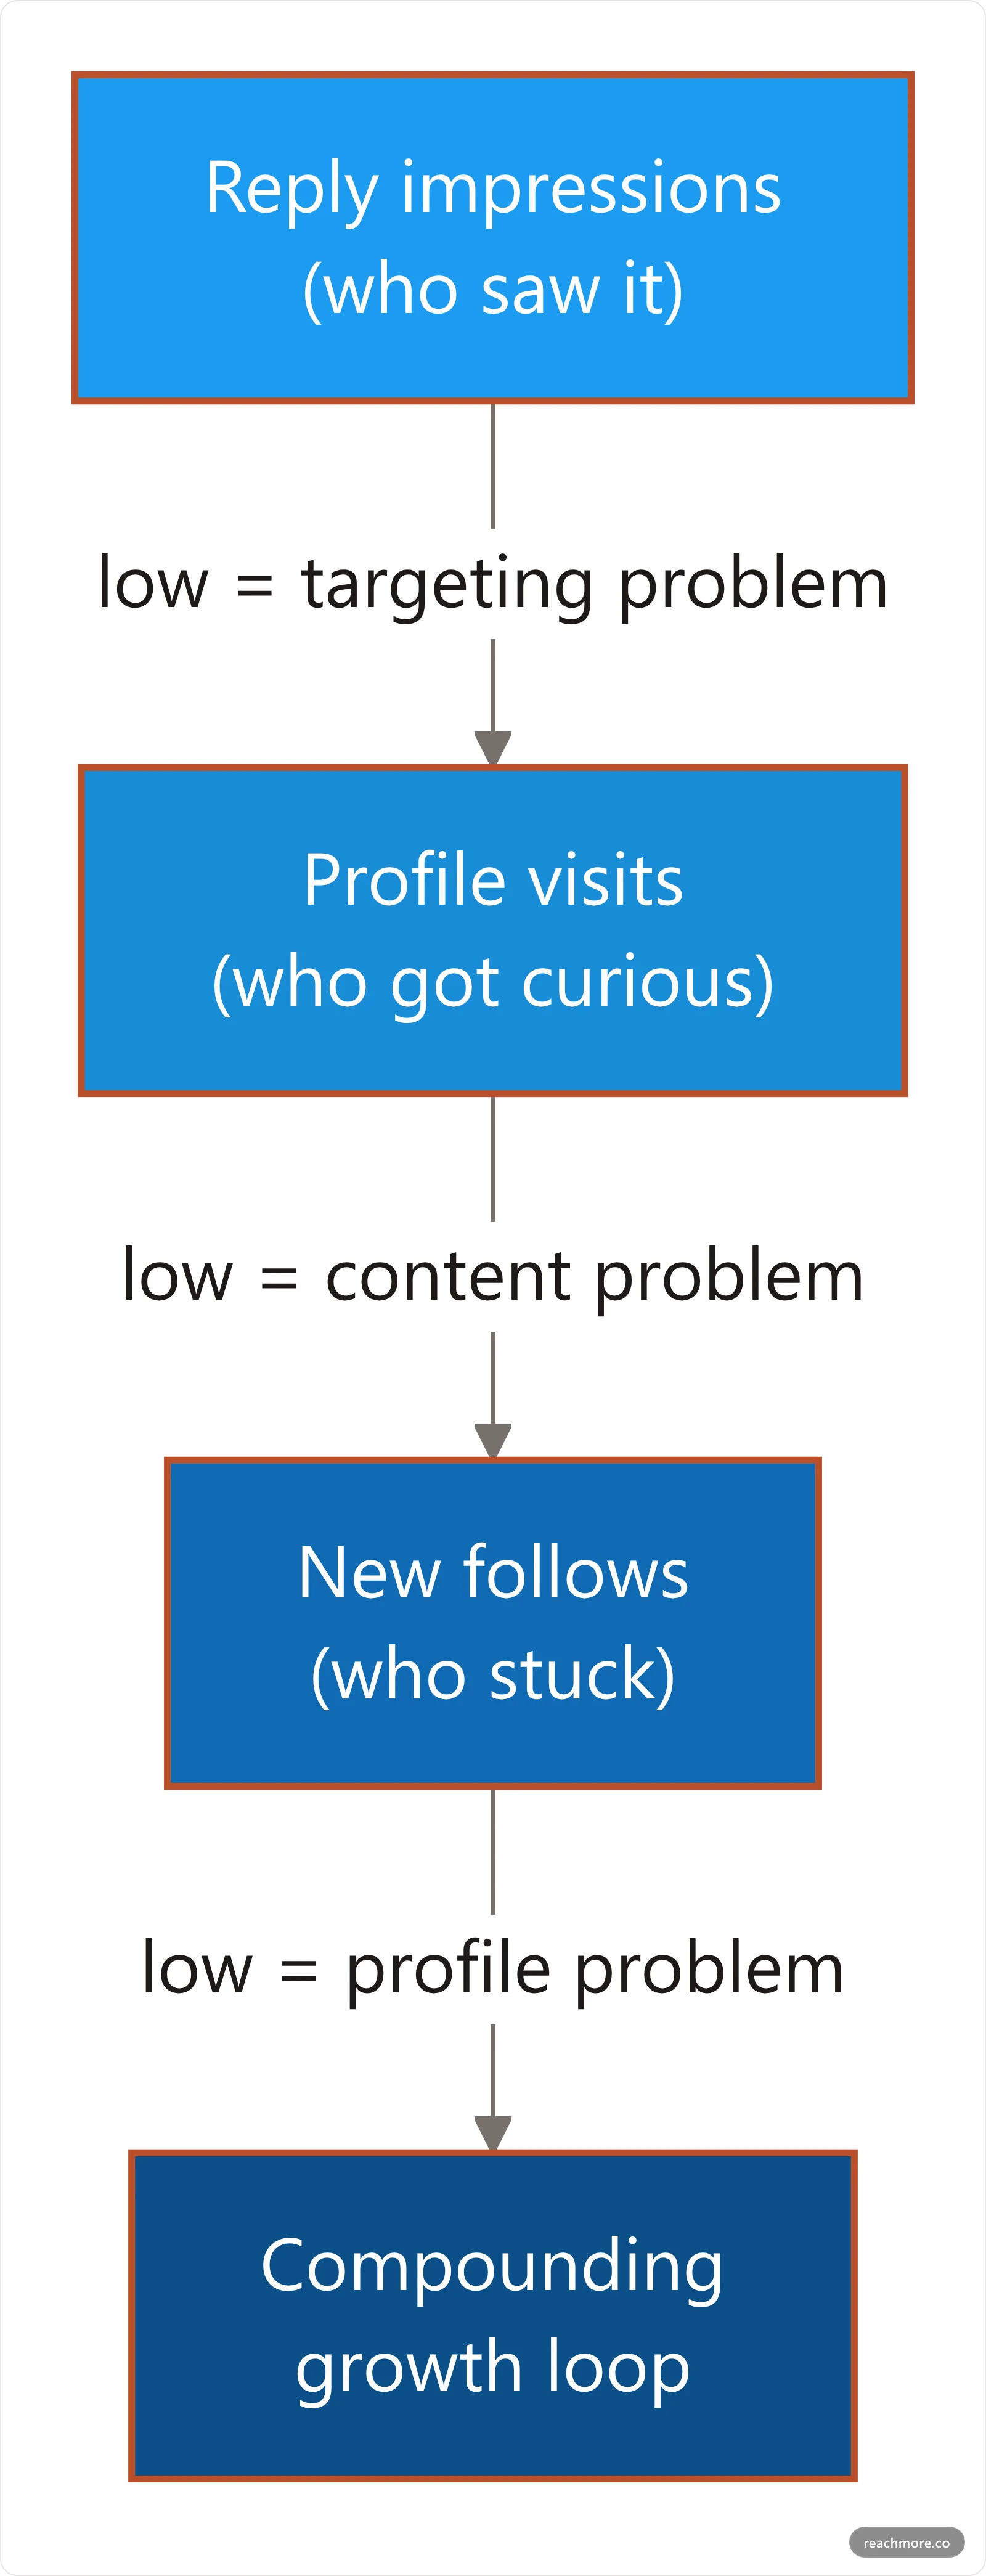
The single most useful number you can compute is profile-visit rate: profile visits divided by reply impressions. It normalizes for reach, so a small reply that punches above its weight beats a big reply that converts nobody. Track that one ratio and you already know more than 90% of people replying blindly. For the mechanics behind those views, see why some X replies get no views at all.
What X's native analytics shows free vs Premium in 2026#
Here is the honest 2026 picture: X gives every user basic per-post numbers, but the metrics that matter for replies sit behind Premium — and even then, X never attributes a follow to a specific reply.
Tap any of your replies and you will see impressions, likes, replies, reposts, and bookmarks for free. That is enough to gauge reach, not conversion. The conversion metrics — link clicks, profile visits, detail expands, and engagement rate — are generally unlocked with X Premium. Account-level trends live at x.com/i/account_analytics with a 28-day default view of impressions, engagement rate, profile visits, and new follows, and that dashboard is Premium-gated too — worth weighing if you're deciding whether X Premium is worth it.
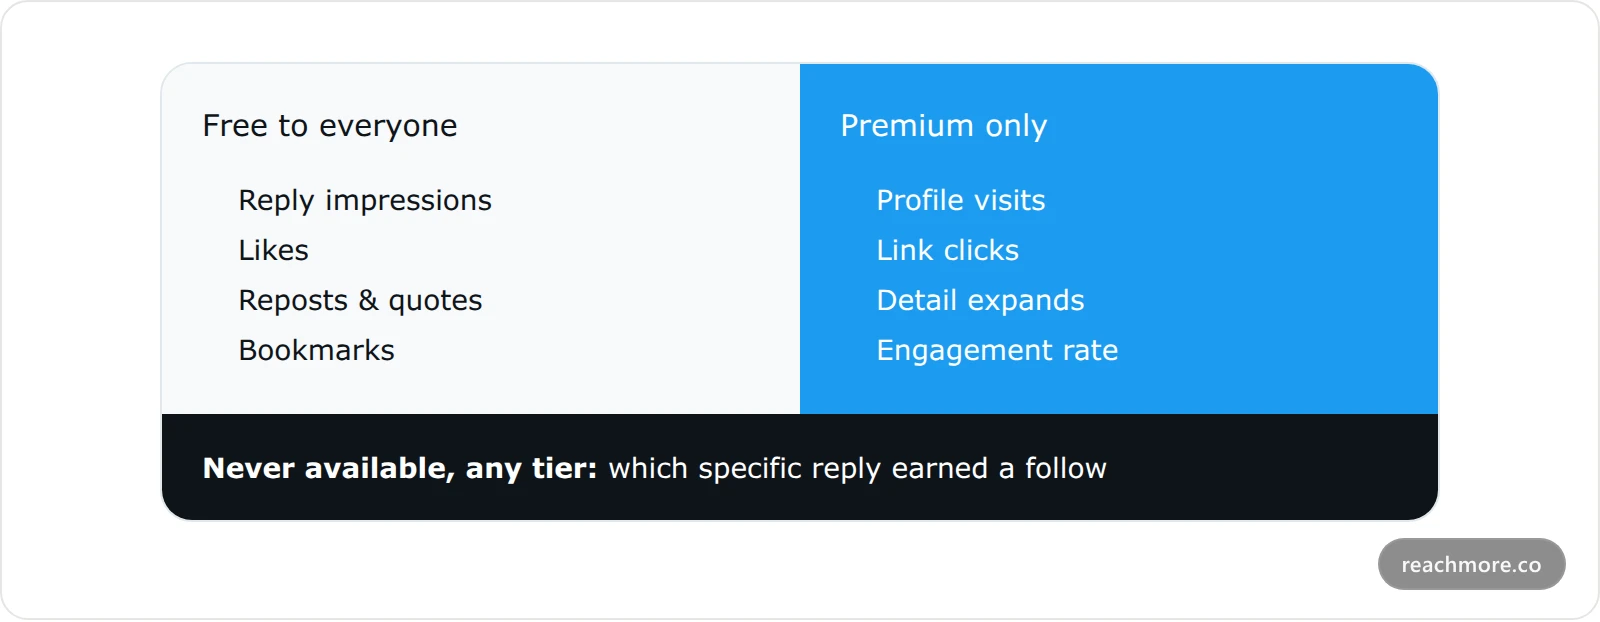
That last row is the whole point. X is post-centric — it can tell you 14 people visited your profile today, but not that 9 of them came from your reply to a specific account. Bridging that gap is manual work, which is exactly what a scorecard is for.
What counts as a good reply engagement rate on X in 2026#
There is no single "good" engagement rate on X in 2026, and anyone who quotes one number is hiding the methodology. The benchmarks disagree by two orders of magnitude because they measure different things.
RivalIQ, measuring engagement per follower across millions of posts, put the median X engagement rate at just 0.015% in 2025 — down from 0.029% in 2024, the lowest of any major platform. Socialinsider, measuring per impression, reports a median closer to 1.11%. Hootsuite cites an average around 1.8%. Same platform, wildly different math.
Source | 2025–2026 figure | How it's measured |
|---|---|---|
0.015% median | Engagements ÷ followers | |
~1.11% median | Engagements ÷ impressions | |
~1.8% average | Engagements ÷ impressions |
The standard impression-based formula is: (likes + replies + reposts + quotes + clicks) ÷ impressions × 100. Pick one formula and stay consistent — a benchmark only helps if you compare like with like. For replies specifically, stop chasing a platform-wide average and track your own profile-visit rate trend instead. If you want the full breakdown, read what a good engagement rate on X really means in 2026.
The reply-weight myth: why the 13.5× number is dead in 2026#
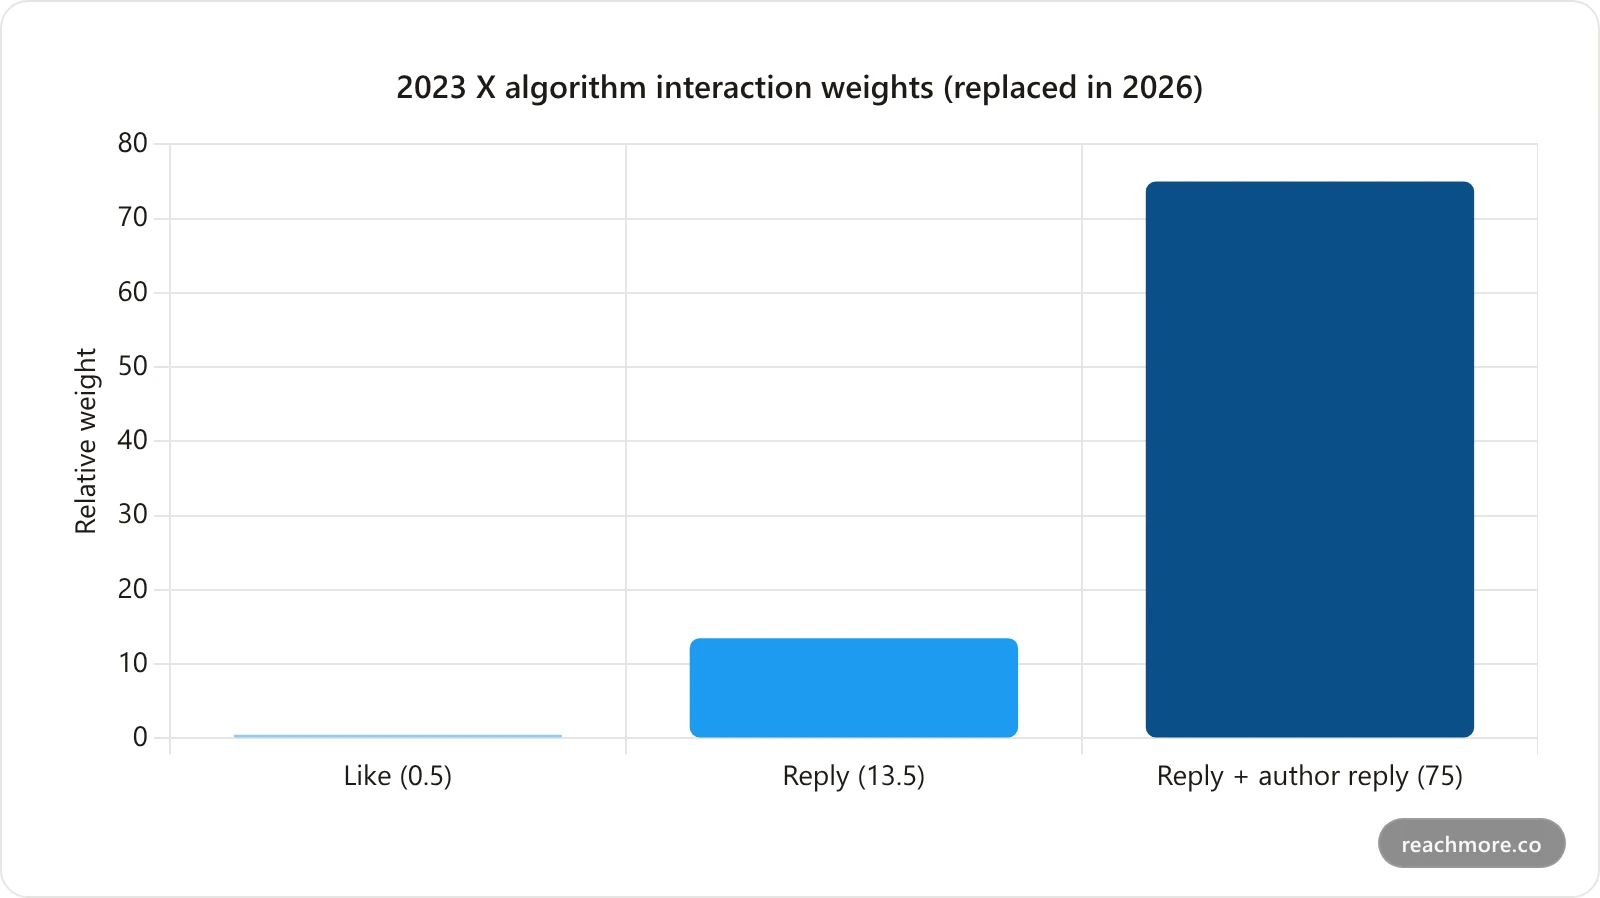
If you have read any reply-growth post, you have seen the claim that the algorithm weights a reply 13.5× a like, and 75× if the author replies back. Here is the uncomfortable update: those numbers are from 2023, and they no longer describe how X ranks anything.
Those weights came from the Scala recommendation code X open-sourced in 2023 — like = 0.5, reply = 13.5 (27× a like), and a reply that earned an author's reply = 75 (150× a like). They were real, hand-tuned constants. In January 2026, X's engineering team open-sourced a new recommendation system built on the same transformer architecture as Grok, replacing those hand-tuned weights with learned weights that X did not publish.
"We have open-sourced our new 𝕏 algorithm, powered by the same transformer architecture as xAI's Grok model." — @Engineering, X
The practical takeaway is not "replies stopped mattering." Replies are still one of the strongest signals on the platform, and an author replying back is still the gold standard. But the exact multipliers are unknowable now, and a transformer scores your reply's quality and sentiment directly — rewarding on-topic, constructive replies and throttling low-effort or combative ones. That means "just reply 50 times a day" is obsolete advice. Quality is modeled. Measure conversion, not volume. The deeper mechanics are in the complete X reply strategy playbook.
How to build a Reply Scorecard you can copy#
Since X will not attribute follows to individual replies, your X reply analytics has to be a lightweight scorecard you build yourself to track your replies over time. It takes one spreadsheet and about 60 seconds per reply, and within two weeks it tells you your highest-converting reply patterns.
Log every reply worth tracking — not all of them, just the ones under bigger accounts where growth is possible. Note the account you replied to, your reply angle, and the three funnel numbers once the reply has had 24 hours to breathe. Then compute profile-visit rate. Sort by that column and your winners rise to the top.
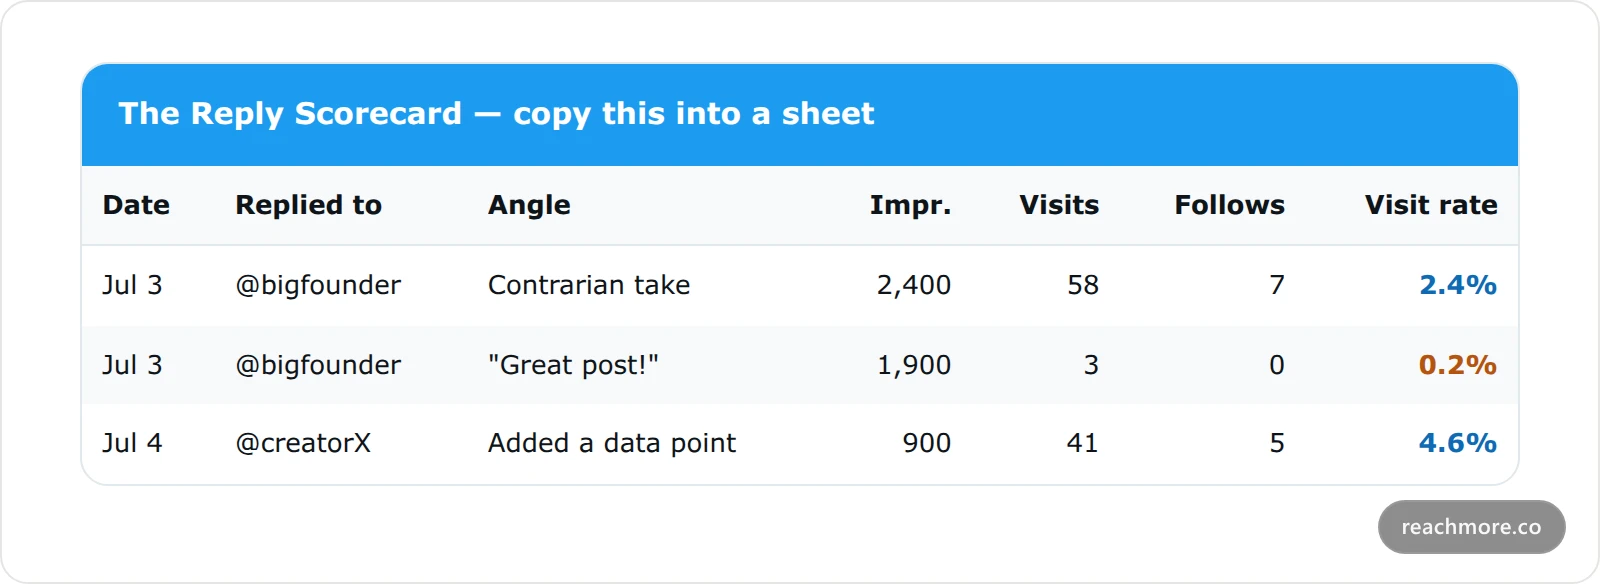
Look at the example above. The "Great post!" reply got the second-most impressions and converted nobody. The reply that added a data point had the fewest impressions and the highest visit rate. Within a week of logging, patterns like that jump out — and you stop writing the replies that feel productive but do nothing. Want to test two angles fast? ReachMore drafts each one in your voice right inside X, so you can ship both and let the scorecard pick the winner.
A 15-minute weekly reply audit#
You do not need to live in a dashboard. A focused 15-minute audit once a week turns raw reply data into next week's playbook. Run it every Monday and your reply strategy compounds instead of resetting.
Start by pulling your scorecard and sorting by profile-visit rate. The top five rows are your template — what account type, what angle, what length. The bottom five are your kill list — stop writing those. Then check one thing X does show: did any high-visit replies fail to convert to follows? If so, the leak is your profile, not your replies, and no amount of better replying fixes a weak bio.
Run the audit in four steps:
Pull the scorecard and sort by profile-visit rate.
Copy the top five — the account type, angle, and length that convert.
Kill the bottom five — the patterns that burn time and convert nobody.
Pick five target accounts for next week and feed them your winning angle.
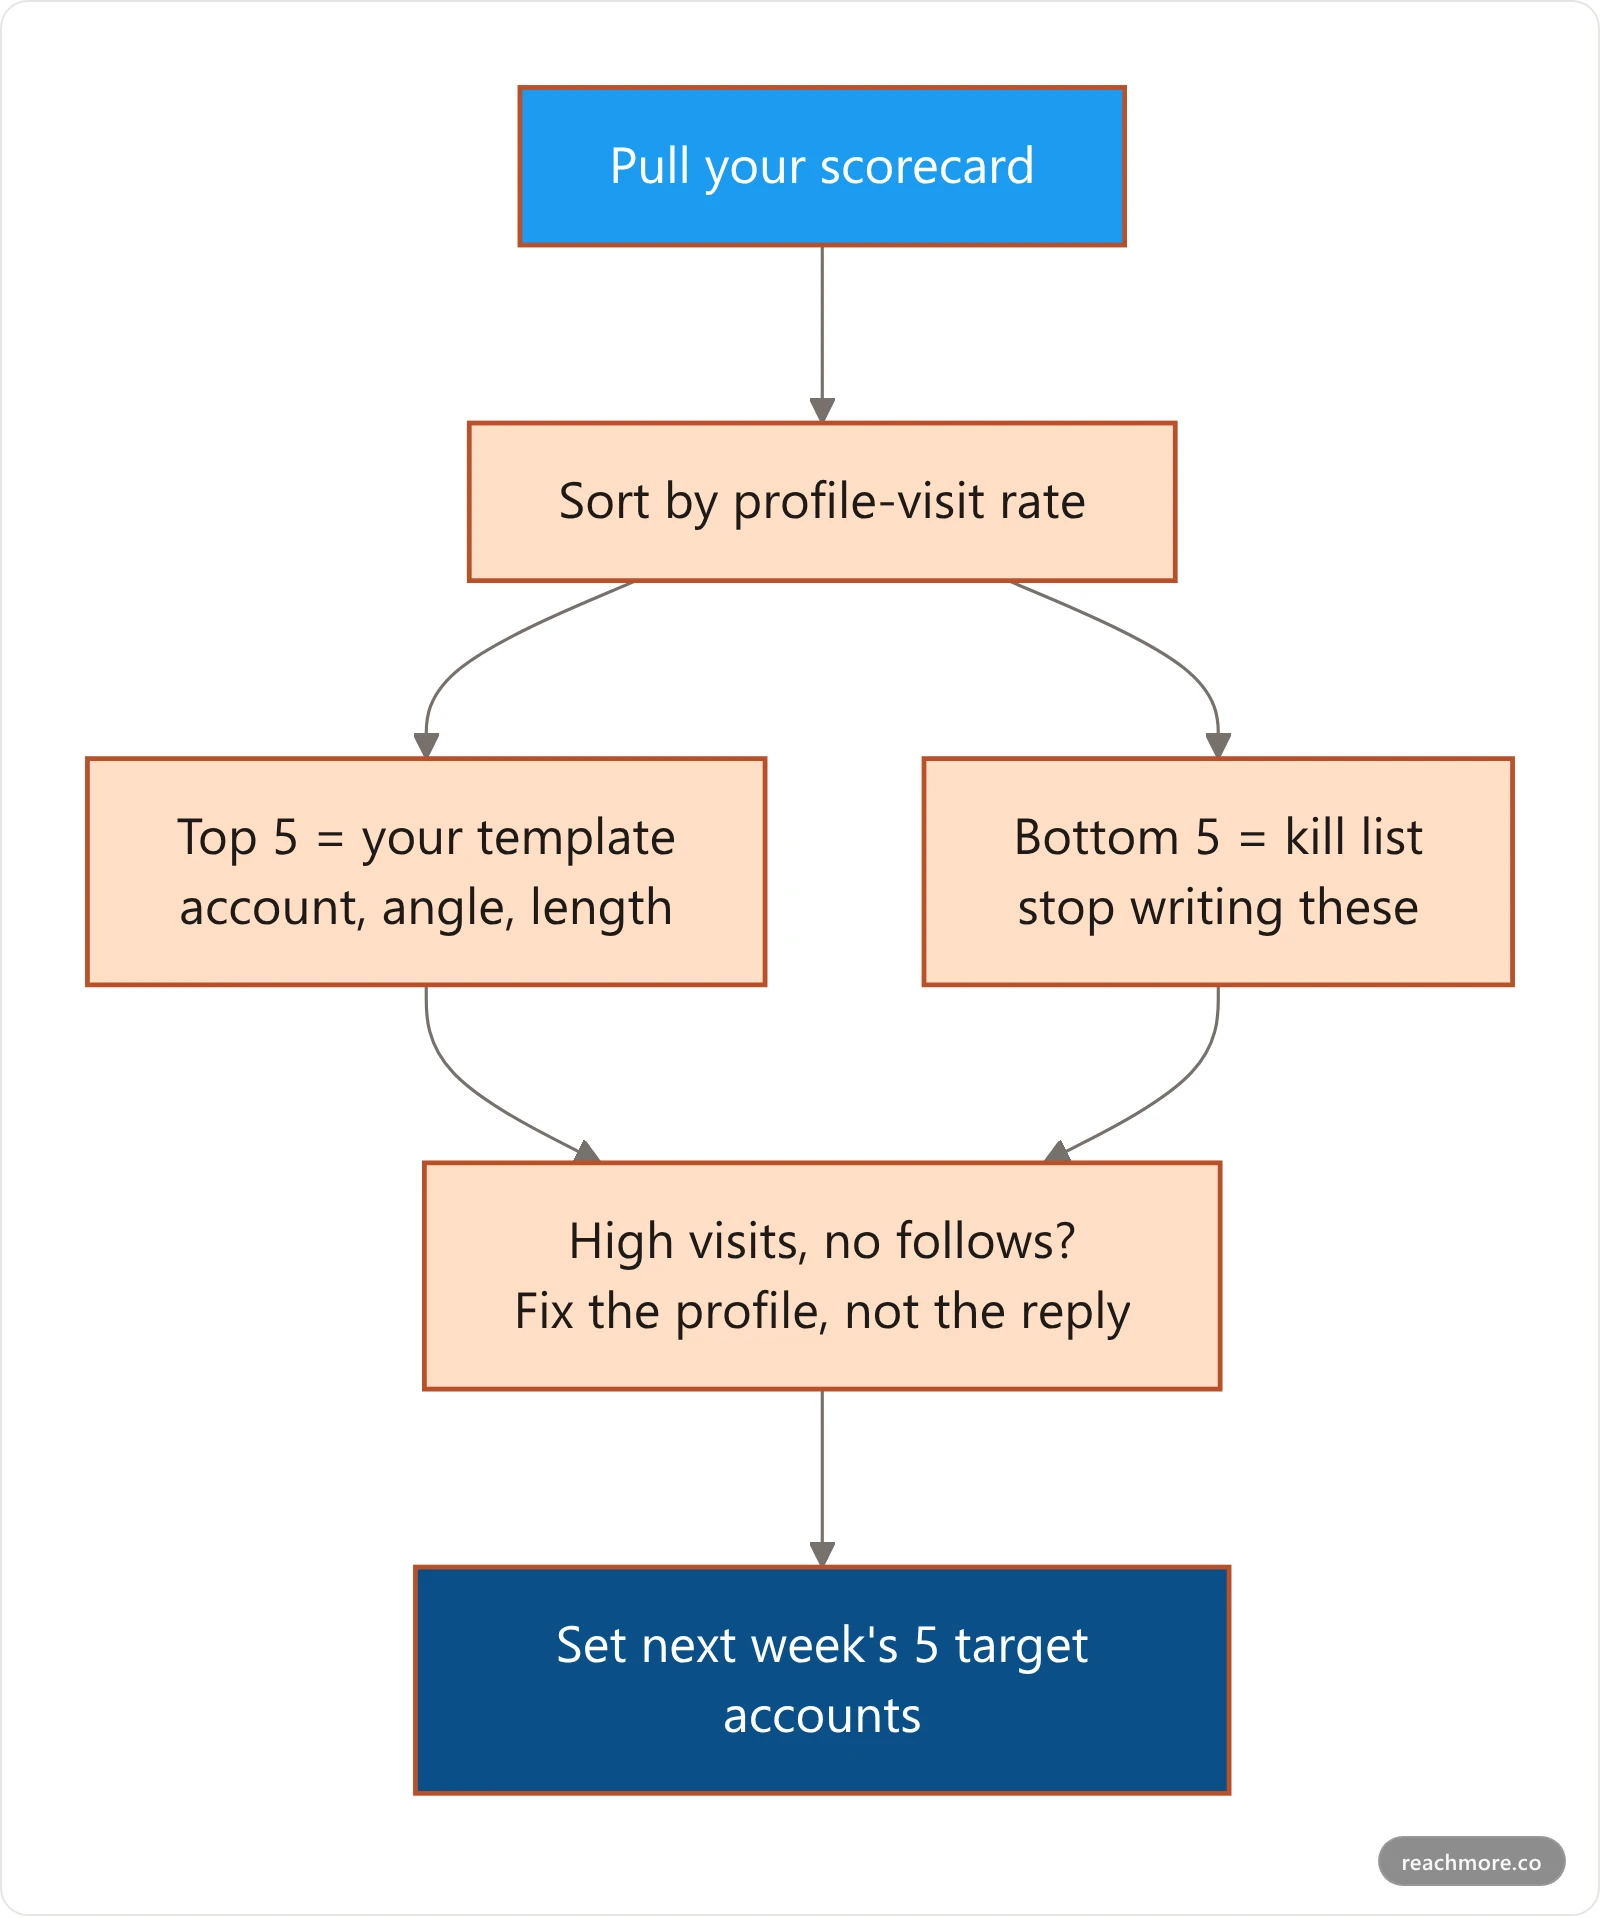
Finish by choosing five target accounts for the week ahead — accounts whose audience overlaps yours and who reliably get reach. Feed the winning angle into those, and re-measure next Monday. That loop is the entire job. For a faster version, pair it with the first-30 reply-speed method so your tracked replies also land early enough to be seen.

Turning reply data into a compounding loop#
Measurement only pays off if it changes what you do next. The point of a scorecard is not a tidy spreadsheet — it is a shorter list of higher-converting reply patterns every single week.
Once you know your best angle converts at 4% and your worst at 0.2%, the math is brutal and freeing. Twenty replies in your winning pattern beat 80 scattered ones, and they take a quarter of the time. That is how someone replying 30 minutes a day outgrows someone grinding two hours — they measured, cut the dead weight, and doubled down. Reach benchmarks and cadence are covered in how to increase your reach on X and how to get more replies on X.
The compounding kicks in because followers from replies are pre-qualified — they found you through a take they liked, so they engage more, which lifts your own posts' reach, which earns more profile visits. Reply analytics is simply the instrument panel for that loop. Install ReachMore for Chrome and you spend your attention on the angle worth measuring, not on staring at a blank reply box.
Frequently Asked Questions#
How do I see analytics for a single reply on X?#
Tap your reply, then tap the impressions or "View post analytics" link beneath it. Free users see impressions, likes, reposts, quotes, and bookmarks. Deeper metrics — profile visits, link clicks, detail expands, and engagement rate — generally require X Premium. X does not show which reply earned a follow, so you track that yourself with a scorecard.
Can I track which replies got me followers?#
Not directly — X never attributes a specific follow to a specific reply. You reconstruct it manually: log each tracked reply's impressions and profile visits, note your daily follower change, and correlate spikes to your highest-visit replies. Over a week or two, patterns emerge clearly enough to tell which reply angles and target accounts convert best.
Does X show reply impressions to free users?#
Yes. Impressions (views) on your replies are visible to everyone, most reliably in the mobile app under each post. What free users do not get are profile visits, link clicks, detail expands, and engagement rate — the conversion metrics that tell you whether an impression turned into curiosity. Those sit behind X Premium in 2026.
What is a good engagement rate on X in 2026?#
There is no single number. RivalIQ measures per-follower engagement and reports a 2025 median of 0.015%; Socialinsider measures per impression and reports around 1.11%; Hootsuite cites roughly 1.8%. The gap is methodology, not reality. Pick one formula, stay consistent, and track your own trend rather than chasing a platform-wide average.
How much does the algorithm weight a reply versus a like?#
The famous "13.5× a like, 75× with an author reply" numbers are from the 2023 open-source Scala algorithm. X replaced that system in January 2026 with a Grok-based transformer whose weights are learned and unpublished. Replies remain a top signal and author replies remain the strongest, but the exact multipliers are no longer knowable.
What are profile visits and why do they matter for replies?#
Profile visits count people who clicked through to your profile after seeing your content. For replies, this is the single most important metric — it is the step between a stranger seeing your reply and following you. A reply with high impressions but few profile visits was seen and forgotten; high profile visits mean your reply made people curious about you.
Is X Premium worth it just for the analytics?#
If replies are your main growth channel, the profile-visit and engagement-rate data alone can justify it, since those are the metrics that reveal which replies convert. But you can still grow without it by tracking free impressions plus your daily follower change in a scorecard. Premium buys precision, not the strategy itself.
How many replies a day should I post to grow?#
Quality now beats volume because X's 2026 algorithm scores reply quality directly. Rather than a fixed count, aim for 10–20 focused replies under accounts whose audience overlaps yours, then let your scorecard tell you which converted. Fewer high-visit-rate replies outperform dozens of low-effort ones — and cost far less time.
The bottom line#
Three things separate creators who grow from replies and those who just tire themselves out. First, measure the Reply-to-Follow Funnel — impressions, profile visits, follows — not likes; profile-visit rate is your north star. Second, stop quoting the dead 13.5× weight — X's 2026 Grok-based system scores quality, so a 4% angle beats a 0.2% one every time. Third, run a 15-minute weekly audit so 20 sharp replies replace 80 blind ones.
Good X reply analytics is not a dashboard — it is a habit. X will not hand you per-reply attribution or tell you which X replies get followers, so a copyable scorecard is the whole trick. Log, sort, cut, repeat — and your follower count starts tracking your effort instead of ignoring it.
Want to turn every reply into reach? Install ReachMore for Chrome →
Reply analytics are only one slice of the picture. If you're deciding where to track all of it, our ranked guide to Twitter analytics tools compares 7 options on what each can actually see — and why competitor impressions aren't available to any of them.
Turning those reply numbers into a single score? Our guide to what a Twitter engagement rate calculator is actually dividing by covers the two formulas, why they disagree on the same post, and which denominator to trust.


