You have 2,400 followers. Your post got 45 likes, 12 replies, 8 reposts and 5 bookmarks. One calculator says your engagement rate is 2.92% and calls it "excellent." Another says 0.67% and calls it "low." Neither is broken. They divided by different things.
There are two engagement rates, and they answer different questions. Divide engagements by followers to measure how loyal your audience is. Divide by impressions to measure how well a post converted the people who actually saw it. On the same post, the two numbers routinely differ by a factor of ten.
Almost every twitter engagement rate calculator on the web picks the first one, because followers is the only number it can see from outside your account. That was the right choice in 2015, when your timeline was your followers. It is the wrong one now.
If you came here looking for how to calculate engagement rate on Twitter, the short version is that there is no single engagement rate formula. There are two, and picking the wrong one will flatter or punish you for reasons that have nothing to do with what you wrote.
We build an X composer with its own insights panel and a free engagement rate calculator, so the choice of denominator is one we had to make in code. Here is what each formula measures, which one to trust, and where the honest numbers come from.
The two formulas every Twitter engagement rate calculator must choose between#
Both formulas share a numerator. They differ entirely in what they divide it by — and that single choice changes the story your number tells.
By followers | By impressions | |
|---|---|---|
Formula | engagements ÷ followers × 100 | engagements ÷ impressions × 100 |
Answers | How responsive is my audience? | How good was this post? |
Denominator visible to | Anyone | Only the account owner |
Moves when you gain followers | Yes — it falls | No |
Moves when a post goes wide | Yes — it rises | No |
Good range | 1%–3% | 2.5%–5% |
Best for | Comparing accounts | Comparing posts |
The rows that matter most are the two middle ones. Follower-based rate is contaminated by things that have nothing to do with the post: gain 10,000 followers overnight and every future post's rate collapses, even if your writing improved. Impression-based rate holds still, because the denominator is the actual audience the post reached.
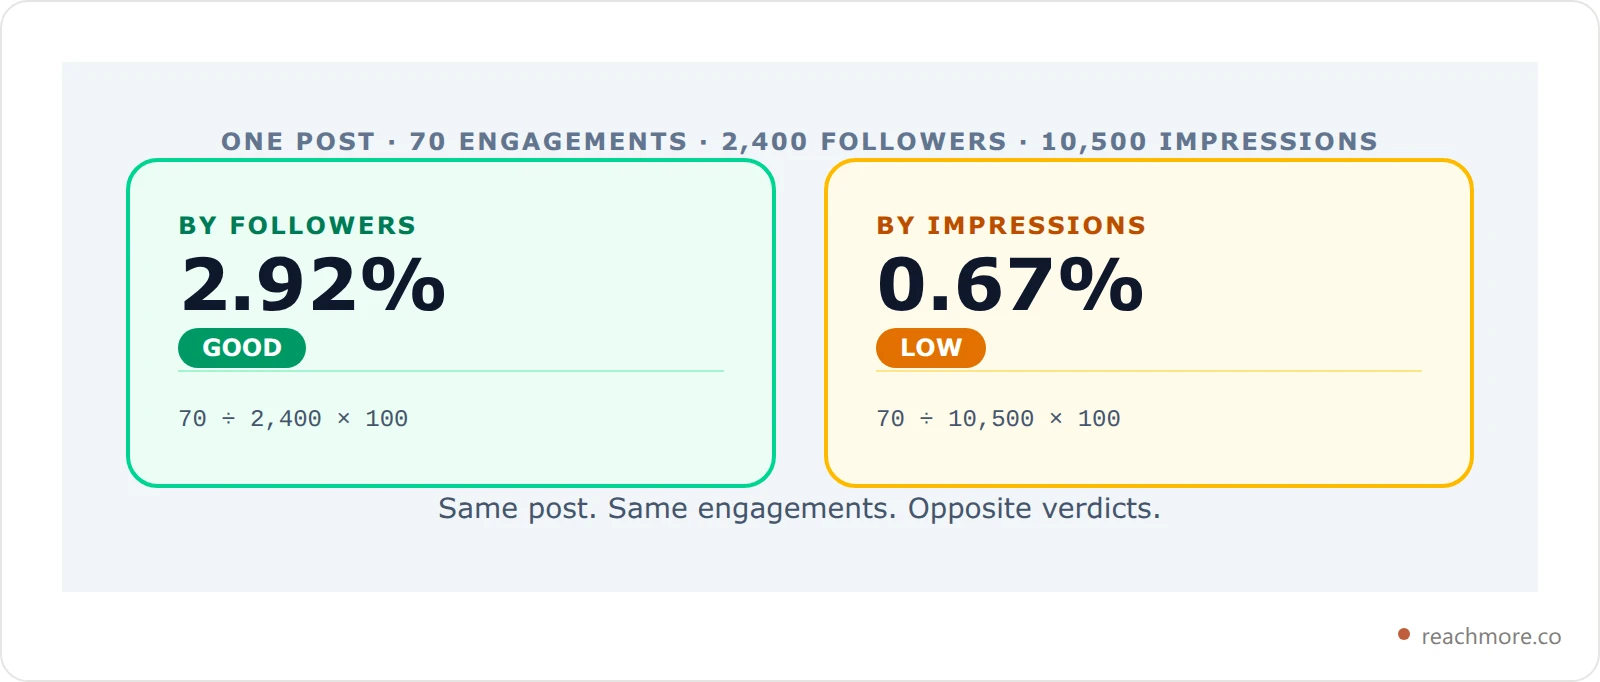
Read together, those two numbers actually tell you something precise: this post reached far beyond your follower base, and most of the strangers it reached scrolled past. That's a distribution win and a copywriting miss — a diagnosis neither number gives you alone.
What actually counts as an engagement#
Before the denominator argument, settle the numerator. X's API returns six per-post metrics in the public_metrics object, documented in X's Tweet object data dictionary:
like_countreply_countretweet_countquote_countbookmark_countimpression_count
Five of those are engagements. The sixth is the denominator.
ReachMore's free engagement rate calculator takes four of them — likes, replies, reposts and bookmarks — and adds them into a single engagement count. There's no quotes field, so if quotes are a meaningful signal in your niche, add them into the reposts box yourself. It's a deliberate simplification, not an oversight: quotes are the rarest of the five for most accounts, and a fifth input box costs more clarity than it buys.

Two of those five deserve more weight than a flat sum gives them, and it's worth knowing why even if you don't adjust for it:
Bookmarks are the strongest private signal. Nobody bookmarks a post to perform approval — there's no audience for it. A high bookmark share means people intend to come back, which is the closest thing to a "this was useful" vote that X exposes.
Replies are the most expensive. A like costs a tap; a reply costs a sentence and a small social risk. Accounts that grow through conversation see reply share climb long before follower count does, which is why reply analytics tend to lead the growth curve rather than follow it.
If you only ever look at the flat rate, a post with 60 likes and a post with 20 likes plus 40 replies score identically. They are not the same post.
Why followers is the wrong denominator in 2026#
Here's the structural problem. A follower-based rate assumes your followers are your audience. On X in 2026, they are neither the whole audience nor even reliably part of it.
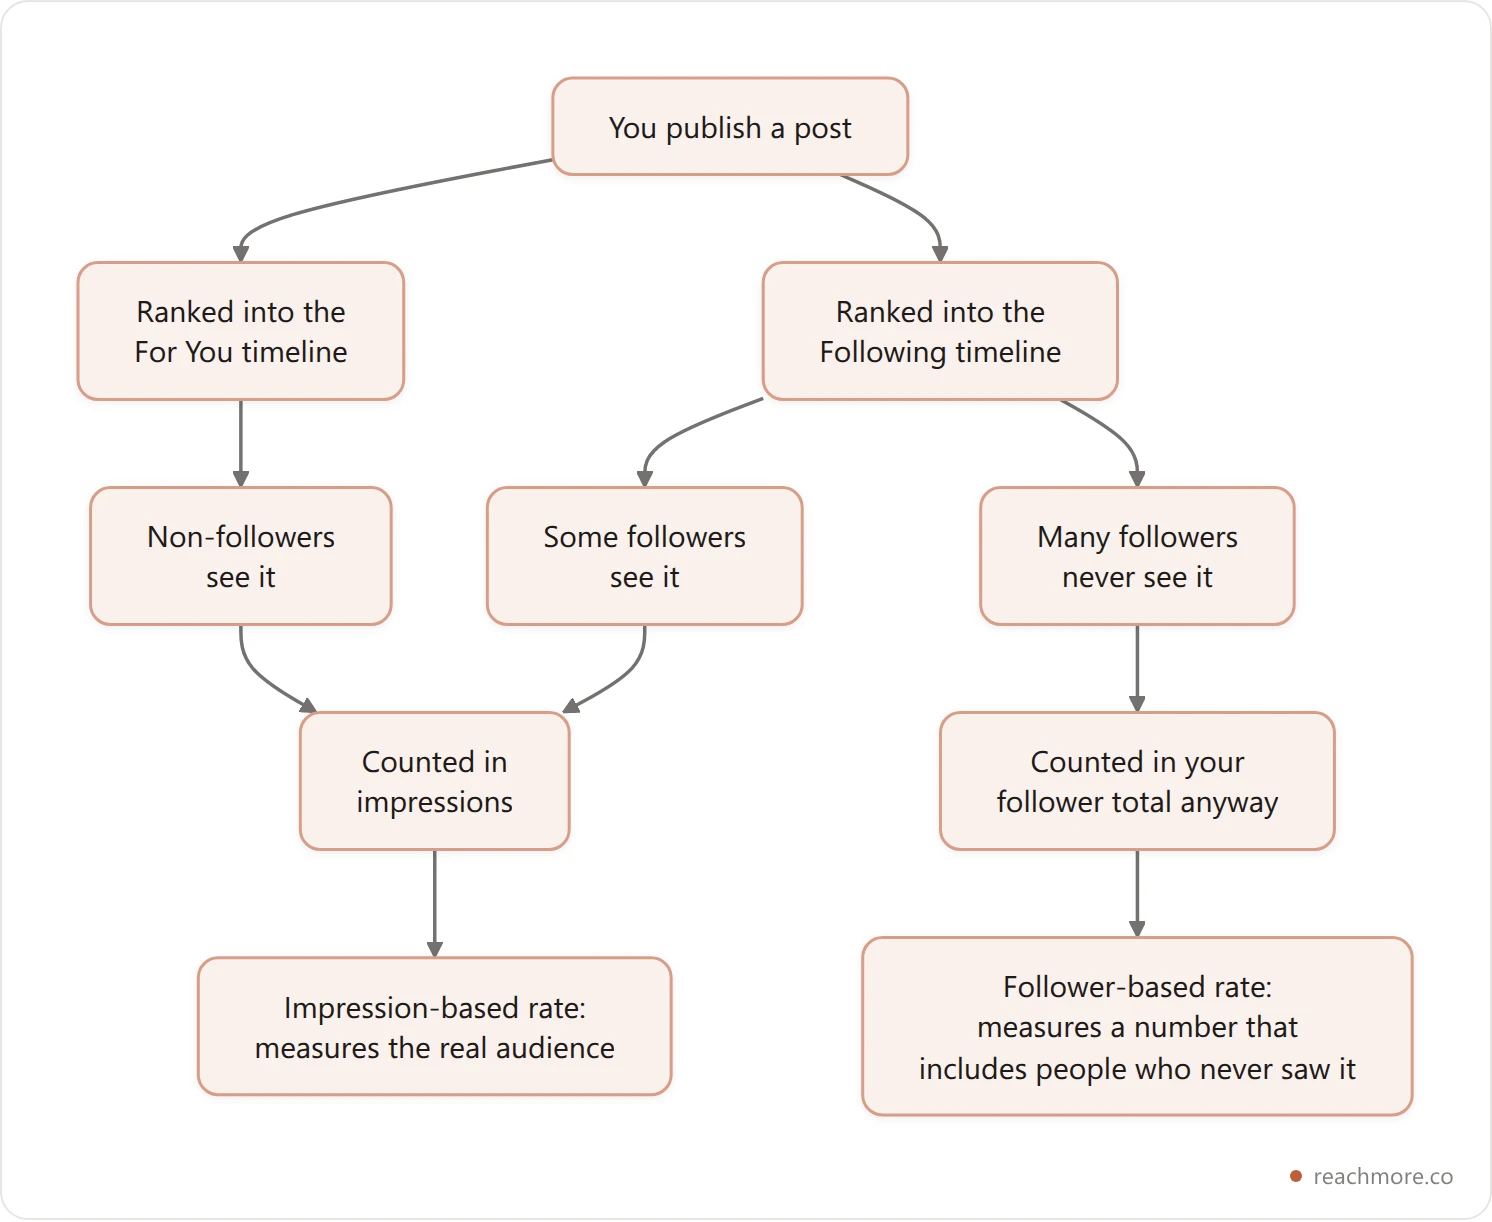
Two things break the follower assumption at once. Your post is served algorithmically, so only a fraction of your followers see it — and it's served to non-followers through For You, so a chunk of your reach was never in the follower count to begin with. The denominator both overcounts and undercounts, in different directions, on every single post.
This gets worse the bigger you get. Follower counts accumulate — inactive accounts, one-time followers from a viral moment, dormant profiles — while impressions reflect only live attention. A 100,000-follower account with 30% dormancy is being scored against 30,000 people who will never see anything it posts. That's why large accounts show alarming-looking follower-based rates and perfectly healthy impression-based ones. Our breakdown of what counts as a good engagement rate on X walks through the benchmark bands by account size.
There is exactly one thing follower-based rate is genuinely good for: comparing two accounts from the outside. You can see anyone's follower count and anyone's likes. You cannot see anyone's impressions but your own — which is the whole reason the SERP is full of follower-based calculators.
Run your own numbers through both formulas →
What counts as good on each scale#
Because the two formulas produce different numbers, a healthy X engagement rate looks different on each scale, and each needs its own benchmark bands. Scoring an impression-based rate against follower-based thresholds is how a perfectly healthy post gets labelled a failure.
These are the bands the ReachMore calculator uses:
Verdict | By followers | By impressions |
|---|---|---|
Low | under 0.5% | under 1% |
Average | 0.5% – 1% | 1% – 2.5% |
Good | 1% – 3% | 2.5% – 5% |
Excellent | above 3% | above 5% |

Notice the impression bands sit higher across the board. That's not a harder grading curve for its own sake — it reflects that an impression is a much weaker unit than a follower. A follower opted in once; an impression is a post sliding past a thumb. Converting 3% of people who chose you is ordinary. Converting 5% of people who didn't is genuinely good.
Two caveats worth stating plainly. These bands are a sanity check, not a law of physics — niche, format, and account age all move them. And any benchmark you read anywhere, including this one, is worth less than your own 90-day baseline. The only comparison that reliably means something is you against you.
Where the impressions number actually comes from#
If impression-based rate is the better metric, the obvious question is where you get impressions — and the answer explains why so few calculators offer it.
impression_count comes back from X's API for your own posts, alongside the rest of the post metrics X documents. There is no endpoint that hands you a stranger's impressions, which is why no analytics tool on the market can show you a competitor's true engagement rate, only their follower-based approximation. We covered that ceiling in detail in our ranked guide to Twitter analytics tools.
You have three practical routes to your own numbers:
X's native analytics. Open any of your posts and tap the bar-chart icon. Free, immediate, one post at a time.
The API directly. Request
tweet.fields=public_metricsagainst your own timeline. Subject to X's API rate limits, and you're writing the plumbing yourself.A tool that caches the reads. ReachMore's performance report pulls your recent original posts — retweets and replies excluded, so the numbers reflect content you actually authored — at 1 credit per post read. Results are cached, so re-opening the report doesn't re-bill you.
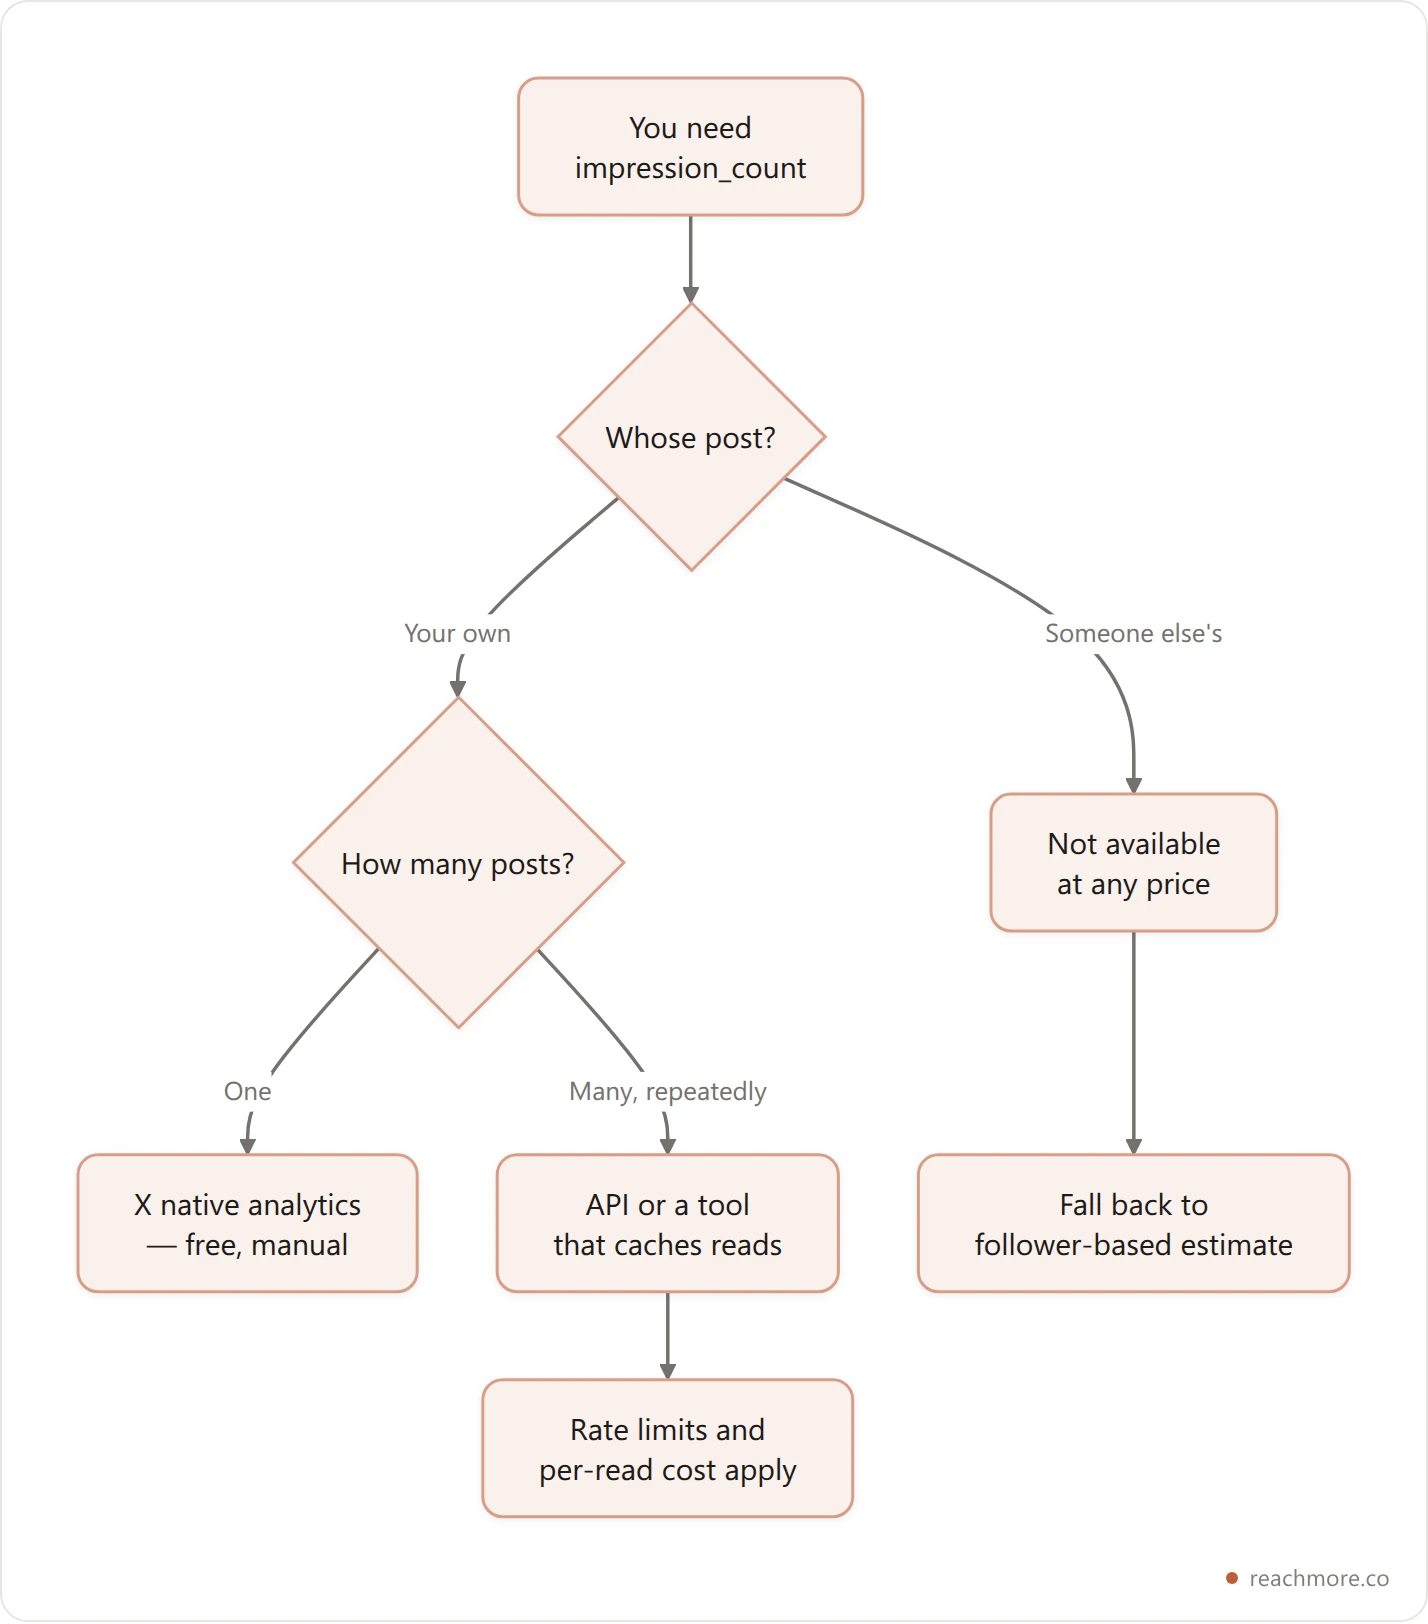
That third route is the one that matters if you're tracking a rate over time rather than checking a single post. Pulling 100 posts' metrics every morning is the kind of workload that hits rate limits fast when you build it yourself, and the cache is doing most of the real work.
Calculating a rate for the account, not just one post#
A single post's engagement rate is noise. One reply from a large account, one lucky reshare, and the number swings wildly. What you want is a rate for a window.
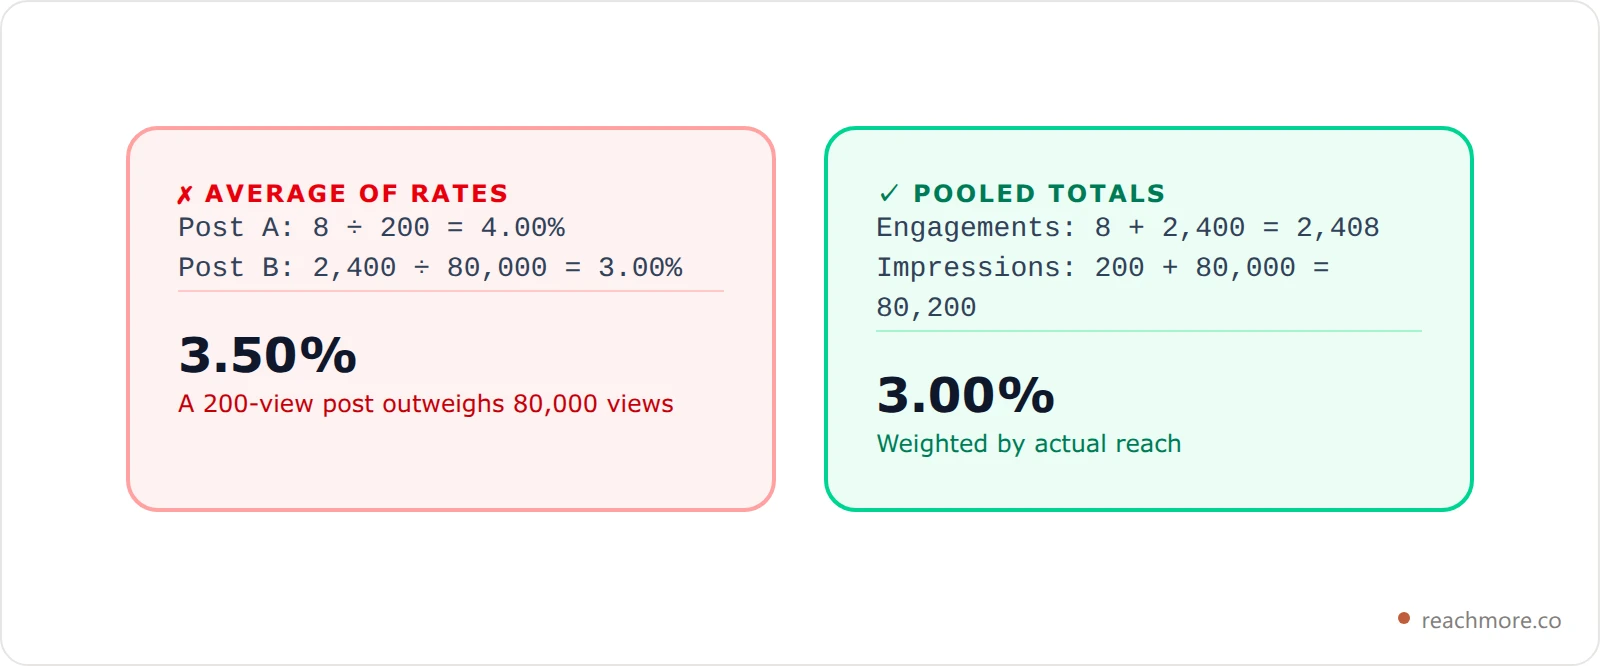
The correct way to aggregate is to sum first, then divide once:
Account rate = (all engagements across the window) ÷ (all impressions across the window) × 100
The wrong way — and the way most spreadsheets do it — is to calculate each post's rate and average those rates. That gives every post equal weight regardless of size, so a throwaway post that reached 200 people and got 8 replies (4%) counts exactly as much as your best post of the month that reached 80,000 and converted 3%. Your average now says 3.5%, which describes no real thing that happened.
Two more rules make a window comparable to the one before it:
Use a fixed window and let posts mature. Impressions keep accruing for days after publish, fastest in the first hours. Comparing a post from this morning against one from last month compares a partial number to a settled one. Pick 28 or 30 days and exclude anything published in the last 48 hours.
Separate originals from replies. Replies typically show far higher engagement rates against far smaller impression counts. Mixed together, a heavy reply week looks like a content breakthrough. Score them as two streams — which is why ReachMore's performance report excludes retweets and replies from the authored-content view by default.
Track the rate across your whole timeline →
Four ways an engagement rate lies to you#
Even with the right formula, the number can mislead. These are the four failure modes worth checking before you act on a rate.
1. Small denominators make spectacular percentages. A post that reached 40 people and got 4 likes scores 10% — "excellent" by any band on the page. It reached 40 people. Below roughly 1,000 impressions, treat the rate as unstable and read the raw counts instead.
2. Your own engagement is in the numerator. Self-replies count. If you thread your own posts, or reply to every commenter (you should), your engagements include your own activity. On small posts that's a material share of the total.
3. Impressions include the scroll-past. An impression is the post entering the viewport, not being read. Two posts with identical impressions can have had wildly different dwell time, and only one of them was actually consumed. Rate treats them as equals.
4. Links suppress the rate on purpose. A post that sends people off-platform converts attention into clicks that don't register as engagement at all — and the link itself costs a flat 23 of your 280 characters under X's weighted counting rules, so it eats hook space too. A link post's low rate isn't a failed post; it's a post whose goal wasn't measured by this metric. Our guide to posting links on X without killing reach covers the placement trade-off.
The unifying point: engagement rate is a ratio, and ratios hide their inputs. Always look at the two raw numbers next to the percentage. A rate that improved because impressions collapsed is not an improvement, and the percentage alone will never tell you that happened.
Turning the number into a decision#
A metric earns its place only if it changes what you do next. Here's how the two rates map to actual decisions:
What you see | What it means | What to change |
|---|---|---|
High by followers, low by impressions | Reached far beyond your audience, converted few of them | The hook — strangers didn't stop |
Low by followers, high by impressions | Small reach, strong conversion | Distribution — timing, replies, format |
Both falling, impressions steady | Content is landing worse | The writing itself |
Both steady, impressions falling | Distribution problem, not a content one | Cadence and posting time |
Rate up, impressions down sharply | Probably an artefact | Nothing yet — check raw counts |
Row two is the most common and the most actionable for accounts under a few thousand followers: the writing is fine, not enough people are seeing it. That is a reach problem, and it's solved by showing up in other people's replies rather than by rewriting your hooks — the mechanics of which we cover in how to get more views on X.
Row one is the trap. It looks like a win in every follower-based calculator on the internet, and it's the post that reached 50,000 strangers and convinced almost none of them. Only the impression denominator surfaces it.
If you'd rather not assemble the numbers by hand every week, ReachMore is a web app that pulls your own post metrics on demand and caches them, alongside a composer, scheduler and follower-growth series. There's no subscription — you top up a credit wallet once, credits don't expire, and reading one of your own posts costs a single credit. What you check often costs almost nothing.
Get impressions and rates for every post you publish →
Frequently Asked Questions#
What is a good X engagement rate in 2026?#
It depends entirely on the denominator. Measured against followers, 1%–3% is good and above 3% is excellent. Measured against impressions, 2.5%–5% is good and above 5% is excellent. Comparing a number from one scale against thresholds from the other is the most common mistake people make.
How do I calculate Twitter engagement rate manually?#
The engagement rate formula is the same on both scales until the final step: add your likes, replies, reposts and bookmarks into a single engagement count. Divide that by your follower count for the audience-loyalty rate, or by the post's impressions for the post-quality rate, then multiply by 100. Do both — the gap between them is the useful part.
Can I check someone else's engagement rate?#
Only the follower-based approximation. Likes, replies and reposts are public, and so is a follower count, so anyone can compute that ratio for any account. Impressions are returned by X's API only for your own posts, so nobody can calculate a competitor's true impression-based rate.
Should bookmarks count as engagement?#
Yes, and arguably they should count for more than a like. A bookmark is private, so there's no social performance in it — it signals genuine intent to return. The ReachMore calculator includes bookmarks in the engagement total for exactly that reason.
Why did my engagement rate drop after I gained followers?#
Because followers is in the denominator. Gaining 5,000 followers instantly divides every future post by a bigger number, even if the posts themselves perform identically. This is the clearest demonstration that follower-based rate measures your audience, not your content — switch to the impression-based rate and the artefact disappears.
How many posts do I need before the rate means anything?#
For a single post, treat anything under about 1,000 impressions as noise. For an account-level rate, pool at least 20–30 posts across a fixed window and let them mature for 48 hours before counting. Pooled totals, not an average of per-post percentages.
Key takeaways#
A twitter engagement rate calculator is doing arithmetic you could do in your head. The value was never the division — it's knowing which denominator answers your question.
Three things worth keeping:
Followers measures your audience; impressions measures your post. Only one of those is something you can act on this week, and it isn't the follower one.
The two rates disagree by design. When follower-based is high and impression-based is low, the post travelled and didn't convert. That diagnosis is invisible if you only ever run one formula.
Ratios hide their inputs. Always read the raw engagements and impressions beside the percentage, or you'll celebrate a rate that rose because reach fell.
Run both numbers on your last ten posts. The pattern in the gap between them will tell you more than either column does on its own — and it takes about five minutes.