

A good engagement rate on X in 2026 is 1–3% measured by impressions, or roughly 1–4% by followers depending on your account size. Anything above 3% by impressions is strong, and above 5% is exceptional. Smaller accounts should aim higher; large accounts naturally compress lower.
That one-line answer hides a trap, though. Most creators calculate the number wrong, compare against the wrong benchmark, then chase the wrong metric to fix it. This guide gives you the real 2026 benchmarks, the exact formula X's own analytics uses, and a repeatable way to lift your rate — grounded in the algorithm weights xAI open-sourced this year.
Your engagement rate is the single best health check on your X presence. Followers are a lagging vanity number. Engagement rate tells you, today, whether people actually care about what you post.
What counts as a good engagement rate on X in 2026?#
A good engagement rate on X in 2026 is 1–3% on an impressions basis and 1–4% on a follower basis. The platform's median sits near 1.11% — the lowest of any major network — so clearing 2% already puts you ahead of most accounts.
The catch is which denominator you use. Impressions-based rates and follower-based rates produce completely different numbers from the same post, so a "3%" from one method is not the same as a "3%" from the other. Compare like with like.
Here's the plain-English scorecard for a typical creator or founder account:
Rating | By impressions (reach) | By followers |
|---|---|---|
Poor | Under 0.5% | Under 1% |
Average | 0.5–1% | 1–2% |
Good | 1–3% | 2–4% |
Strong | 3–5% | 4–6% |
Exceptional | 5%+ | 6%+ |
Use the impressions column if you have access to your analytics (you should — it's the honest one). Use the follower column only when you can't see reach.
How to calculate your engagement rate on X#
Engagement rate on X is total engagements divided by a denominator, times 100. There are two accepted denominators, and picking one is the most important decision you'll make when benchmarking.
Engagement rate by impressions (ERR) — the version X's native analytics reports:
(likes + replies + reposts + quotes + bookmarks + clicks) ÷ impressions × 100
Engagement rate by followers — the version calculators use when reach isn't visible:
(likes + replies + reposts + quotes) ÷ followers × 100
Hootsuite's 2026 formula guide recommends the reach-based version because it measures how compelling a post was to the people who actually saw it — not to your whole follower list, most of whom never scrolled past it.
Worked example: a post gets 12,000 impressions, 220 likes, 30 replies, 18 reposts, and 25 bookmarks. That's 293 engagements ÷ 12,000 = 2.44% by impressions. Solidly "good."

If you don't want to run the math by hand every time, ReachMore's free X engagement rate calculator does it in one paste and returns a verdict on both denominators at once. Which of the two you should actually trust is a longer argument — we make it in our guide to what a Twitter engagement rate calculator is really dividing by.
Engagement rate benchmarks by follower count#
Your benchmark changes with your size. Smaller accounts post to tight, invested audiences and see higher rates; huge accounts reach millions of half-interested scrollers and compress toward the floor. This inverse relationship is the most reliable pattern in the data — the nano-to-mega drop is roughly 6.2× (from 2.18% down to 0.35%).
Call this the Engagement Rate Ladder: engagement rate by follower count, banded so you can find your own rung and benchmark against that — never against a mega-account you happen to follow.
Followers | Good rate (by followers) | What it means |
|---|---|---|
Under 1,000 | 4%+ | Tight niche, warm audience |
1,000–10,000 | 2–4% | The build phase — protect this |
10,000–100,000 | 1–2% | Scaling, some dilution |
100,000–1M | 0.5–1% | Broad reach, lower % |
1M+ | 0.3–0.5% | Mass audience, floor rates |

The lesson: a 1,500-follower account hitting 3% is outperforming a 500,000-follower account at 0.6%, even though the big account gets more raw likes per post. Sprout Social puts it simply — engagement rate is "more meaningful than raw likes" because it's sized to your audience.
Why X engagement rates look so low right now#
If your rate feels low, the platform is partly to blame. X engagement has been sliding for years, and 2026 accelerated it: engagement fell 9.0% year-over-year, the steepest decline of any major platform tracked.
The Rival IQ 2025 benchmark report — built from more than 4 million posts and 9 billion interactions across 14 industries — found Twitter/X posting volume dropped 33%, with several industries falling to near-zero engagement. Fewer people posting means fewer people engaging, which drags every account's rate down.
So before you panic about a 1.2% rate, remember: that's roughly the platform median in 2026. Any honest Twitter engagement rate 2026 benchmark has to start from that floor, and the average engagement rate X posts are earning has been drifting down rather than up. You are not broken. The bar is just lower than it was in 2021, when the all-industry average was noticeably higher.
This context matters for goal-setting. Chasing a "5% like every post" target from an old blog post is a recipe for disappointment. Benchmark against 2026 reality, then out-execute it.
The contrarian truth: chasing likes lowers the number that matters#
Here's the take most X advice gets wrong: more likes is a weak way to raise your engagement rate. Likes are the cheapest, lowest-weighted signal X measures. Optimizing for them optimizes for the wrong thing.
We know this precisely because xAI open-sourced the full For You ranking algorithm on GitHub in January 2026 and shipped its largest update in May. The relative weights are no longer a guessing game. A simplified view of how the ranker values each action:
Action | Relative weight vs a like |
|---|---|
Like | 1× |
Bookmark | ~10× |
Link click | ~11× |
Profile click | ~12× |
Reply | ~13.5× |
Repost | ~20× |
Author replies back to a reply | Huge bonus signal |

Read that table again. A reply is worth roughly 13.5 likes to the algorithm, a repost around 20, and when you reply back to a commenter you trigger a strong "author-replies-back" bonus. As one widely shared summary of the code puts it: a tweet with 50 thoughtful replies outperforms a tweet with 500 likes and no discussion.
Creator Justin Welsh makes the same point from the human side — chasing the most engagement instead of the right engagement keeps you aiming at the wrong prize. On X in 2026, the right engagement is conversation, not applause.
The Weight–Velocity–Volume framework to lift your rate#
To raise your engagement rate on purpose, pull three levers in order. Call it the Weight–Velocity–Volume (WVV) framework — each maps directly to a signal the algorithm rewards.
Weight — engineer for the heavy signals. End posts with a specific, easy-to-answer question so people reply instead of just liking. "Threads or single posts — which do you actually use?" beats "thoughts?" A strong reply strategy is the fastest lever because replies carry 13.5× the weight of a like.
Velocity — win the first 30 minutes. Early interactions carry the most weight, so the algorithm reads a fast start as a signal to show your post to more people. Reply to every comment within the first hour to double the conversation count and keep the thread alive.
Volume — stack reply-to-reply depth. Don't just post; converse. Answering commenters triggers the author-reply bonus repeatedly and compounds the whole post's score.
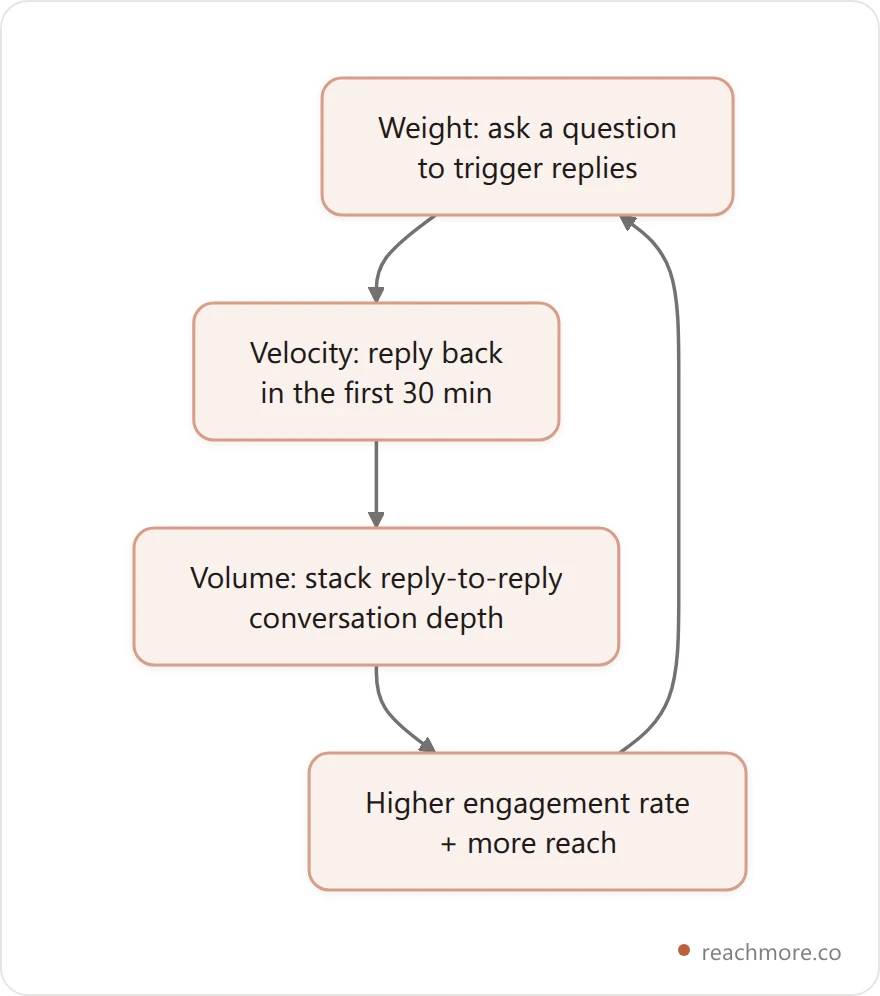
Run this loop on every post and your rate climbs because you're feeding the exact signals the ranker weights highest. If your posts get views but no interaction, our breakdown of why X replies get no views covers the distribution side of the same problem.
A realistic before/after: from 0.4% to 2.1%#
Numbers make this concrete. Here's a representative before/after for a builder account at ~1,200 followers — the kind of profile that thinks it's failing when it's actually just measuring wrong.
Before. Posting one text update a day, ending on a statement. Average post: ~1,800 impressions, 7 likes, 0–1 replies. Engagement rate by impressions: roughly 0.4% — below the platform median, all applause, no conversation.
After (four weeks of WVV). Same posting cadence, three changes: every post ends on a specific question, every early reply gets a reply back within 30 minutes, and two focused replies to larger accounts go out daily. A single reply on a trending post jumped from 200 to 2,000 impressions once the original author responded to it.
Post-level rate climbed to about 2.1% by impressions — a 5× lift — with reply counts up from near-zero to 8–15 per post. Follower growth followed, but the engagement rate moved first. That's the tell: the rate is the leading indicator, followers are the lag.
Check your own rate on both denominators →
Tools to measure and improve your engagement rate#
You can't improve what you don't measure, and X's native numbers are scattered across individual posts. Three moves make measurement painless.
First, calculate consistently. Pick one formula (impressions-based is the honest one) and use the same tool every week so your trend line is comparable. A free engagement rate calculator removes the arithmetic and gives you a tier-adjusted verdict.
Second, track the breakdown, not just the total. ReachMore's Insights shows a per-post split of likes, replies, reposts, and bookmarks, so you can see which heavy signals you're winning and which you're leaving on the table.
Third, make the reply lever repeatable. ReachMore is a web app that drafts replies in your own voice and holds every one in a human approval queue, so winning the first-30-minute velocity window doesn't eat your whole morning — and nothing posts until you approve it. Turning replies into reach is the point — that's how reply-driven growth compounds.
Copy this quick self-audit and run it every Friday:
X ENGAGEMENT RATE — WEEKLY SELF-AUDIT
1. Formula used: impressions-based (keep it consistent)
2. This week's avg engagement rate: ____%
3. My follower-tier target (Ladder): ____%
4. Above or below target? ______
5. Reply-to-like ratio this week: ____ (higher = better)
6. % of posts that ended on a question: ____%
7. % of early replies I answered in 30 min: ____%
8. One change for next week: ______________
Engagement rate benchmarks by industry#
Your niche shifts the bar too. The Rival IQ 2025 study found engagement varies widely by category on X, so a "good" rate for a sports account isn't the same as one for a media brand pumping out dozens of posts a day.
The pattern is consistent: conversation-heavy, identity-driven niches lead, and high-volume broadcast niches lag. Media accounts prove that more posts don't mean more engagement — volume dilutes the rate.
Tier | Representative niches | Why |
|---|---|---|
Leaders | Higher ed, sports teams, tight communities | Loyal, identity-driven audiences that reply |
Middle | Financial services, B2B, creators | Steady, held roughly flat year-over-year |
Laggards | Media, high-volume news | Huge posting volume dilutes per-post rate |
Food and beverage was one of the few categories to post a small gain, while several others slid toward zero. The takeaway for solo builders and founders: don't benchmark against a media brand's feed. Benchmark against accounts your size, in a conversation-friendly niche, and treat replies as your growth engine. If your niche is quiet, your job is to start the conversations others aren't.
5 fast fixes when your engagement rate drops#
A sudden dip usually traces to one of a few habits. Work this list top to bottom.

You stopped asking questions. Statement posts earn likes; questions earn replies. Add one specific, answerable question to your next five posts and watch the reply-to-like ratio move.
You post and leave. The first 30 minutes decide reach. Block ten minutes after posting to reply to every early comment and keep the thread breathing.
You're link-dumping. Raw external links suppress reach. Lead with a standalone insight, then drop the link in a reply — our guide to posting links on X covers the workaround.
You ignore bookmarks. Bookmarks are a heavy "save this" signal weighted around 10× a like. Post genuinely useful, bookmark-worthy content — checklists, frameworks, mini-guides.
You only post, never reply. Replying to bigger accounts borrows their reach. Two focused replies a day on active posts can out-earn your own timeline for total views.
Fix the top item first. In most cases, questions plus fast reply-backs recover a sagging rate within a week.
Frequently Asked Questions#
What is a good engagement rate on X in 2026?#
A good engagement rate on X in 2026 is 1–3% by impressions or 1–4% by followers, depending on account size. The platform median is about 1.11%, so anything above 2% is already strong. Smaller accounts should aim for 4%+ by followers; accounts over 100,000 followers typically land between 0.5% and 1%. Above 5% by impressions is exceptional at any size.
How do you calculate engagement rate on X?#
Divide total engagements by a denominator and multiply by 100. The reach-based formula — (likes + replies + reposts + quotes + bookmarks + clicks) ÷ impressions × 100 — is what X's native analytics uses and the most accurate. The follower-based version swaps impressions for your follower count. Always compare against benchmarks calculated the same way, because the two methods produce very different numbers.
Why is my X engagement rate so low?#
Two reasons. First, the platform: X engagement fell 9% year-over-year in 2026, and the median rate is only about 1.11%, so "low" may just be normal now. Second, your content mix: if your posts earn likes but few replies or reposts, you're winning the weakest signals. Shift to question-led posts and reply back quickly to lift the rate.
Is engagement rate more important than followers?#
For most creators, yes. Follower count is a lagging vanity number; engagement rate measures whether people actually respond to what you post right now. Sprout Social notes engagement rate is more meaningful than raw likes because it's sized to your audience, and brands increasingly weigh engagement rate above follower count when judging accounts. Track both, but let engagement rate drive your decisions.
What is the average engagement rate on X?#
The 2026 median engagement rate on X is roughly 1.11% — the lowest of any major social platform, and down about 9% from the prior year. Buffer's cross-platform benchmark has put X's average closer to 2.31% in some samples, but the difference comes from formula and sample choices. As a working rule: 1% is average, 2–3% is good, and 5%+ is exceptional on an impressions basis.
Does replying increase your engagement rate?#
Strongly, yes. Replies are weighted around 13.5× a like in X's open-sourced ranking algorithm, and when the original author replies back it fires an additional bonus signal. Ending posts with a specific question and answering early comments within the first 30 minutes are the two highest-leverage habits for raising your rate. Conversation depth, not applause, drives the score.
What engagement rate should an account under 1,000 followers aim for?#
Small accounts should target 4%+ by followers, and often more. With a tight, invested audience and low reach dilution, sub-1,000 accounts routinely hit 4–6%. If yours is under 2%, the issue is usually content that earns passive likes instead of replies. Ask questions, join active conversations, and reply back fast to climb.
Do X Premium subscribers get better engagement?#
Premium doesn't change how engagement rate is calculated, but it can lift the reach that feeds it. Premium accounts get a visibility boost for their content — reported as roughly 4× within their network and 2× outside it — which means more impressions and more chances to earn engagement. The signals themselves still have to be earned through good posts and real conversation.
Key takeaways#
Three things to remember. First, a good engagement rate on X in 2026 is 1–3% by impressions — and with the median at just 1.11%, clearing 2% already beats most accounts. Second, benchmark against your rung on the Engagement Rate Ladder, not against mega-accounts; a 1,500-follower account at 3% is outperforming a 500,000-follower account at 0.6%. Third, raise the number by feeding heavy signals — replies weigh ~13.5× a like — using the Weight–Velocity–Volume loop.
Measure with one consistent formula, chase conversation over applause, and win the first 30 minutes. Do that and your rate climbs before your follower count does.
Want to turn every reply into reach? Start with ReachMore →


