

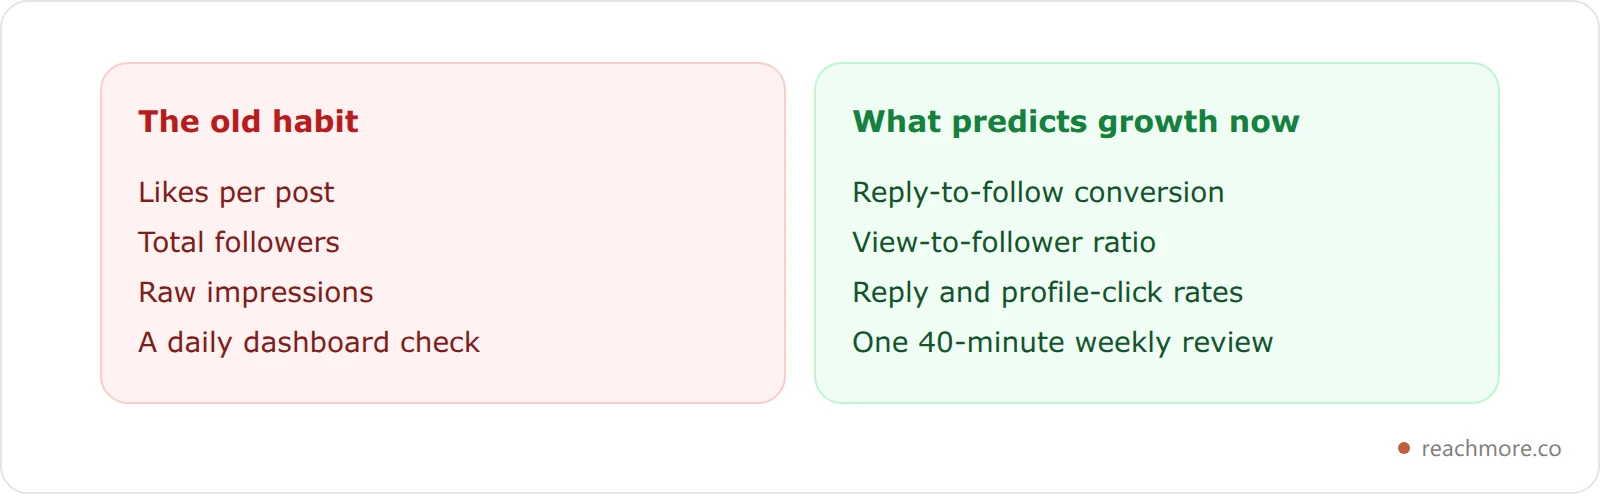
Your X analytics dashboard shows you about thirty numbers. Maybe four of them tell you whether your account will grow next month — and the dashboard doesn't say which four.
X's ranking now leans on reading what a post actually says, and creator payouts moved to a Premium subscription pool. The dashboard looks the same. What its numbers predict doesn't.
Most twitter analytics 2026 guides still teach the 2023 metric stack — impressions, engagement rate, profile visits. That stack was built for a platform that doesn't exist anymore, and the x twitter analytics dashboard won't tell you which of its numbers still mean anything.
X analytics 2026 means tracking a small set of leading indicators — view-to-follower ratio, reply-to-follow conversion, dwell time, and first-30-minute velocity — that predict whether your account grows over the next 30 days, instead of describing what already happened.
This guide walks through the 14 metrics that actually matter, what counts as a good benchmark today, and a 40-minute Sunday review you can run without leaving the dashboard.
What's new in X analytics since the Grok rewrite#
If you opened your dashboard in February 2026 and felt like the numbers got harder to read, you weren't imagining it. Three things shifted in the last six months — and the old playbooks haven't caught up.
Ranking leans on what a post says. X has said its For You ranking now uses Grok to read posts in context, so relevance to the reader counts for more than hashtags or who already follows you. X hasn't published the new model's weights, so treat any exact figure quoted for it as a guess.
Monetization moved off ad share. Social Media Today reported the late-2025 retirement of ad revenue sharing. Creators are now paid from a Premium subscription pool — verified-user impressions count, others don't. Same impressions number on your dashboard, completely different payout math behind it.
Reach is decoupling from follower count. Median engagement on X has collapsed to about 0.10% platform-wide, per Hootsuite's 2026 benchmarks. Premium-boosted accounts run around 0.4%. A small account can out-reach a much bigger one on a single post, because the For You feed ranks predicted engagement rather than follower count.
If your dashboard is the same one you used in 2024, the numbers haven't changed. What they predict has.
The 3-Layer Growth Stack: 14 metrics that actually predict growth#
Every analytics dashboard hands you the same 30 numbers, and most x dashboard metrics describe the past rather than predict the next month. The 3-Layer Growth Stack is the framework that sorts those numbers by what they predict — not what they describe.
Layer 1 is reach. Distribution metrics tell you whether the algorithm is letting your work get seen at all. They move first.
Layer 2 is engagement. Behavioral metrics show whether the impressions you get are actually catching attention. They move next.
Layer 3 is conversion. Outcome metrics translate engagement into followers, signups, and revenue. They move last — and they're what you actually care about.
Track all 14, but weight them in that order. A spike in Layer 3 with no Layer 1 movement is noise. A Layer 1 spike with no Layer 2 follow-through is a sign that your hooks are weak. Read them in sequence, not in isolation.

Want these trends without a spreadsheet? See ReachMore's insights — follower trajectory, engagement rate week over week, and your best hour from your own history.
# | Metric | Layer | What it predicts | Where to find it |
|---|---|---|---|---|
1 | Impressions per post | Reach | Distribution ceiling | Native analytics |
2 | Reach (unique users) | Reach | Audience expansion | Premium |
3 | View-to-follower ratio | Reach | For You penetration | Calculated |
4 | Profile visit ratio | Reach | Hook strength | Native |
5 | Engagement rate | Engagement | Algorithm fit | Native |
6 | Reply rate | Engagement | Conversation pull | Native |
7 | Bookmark rate | Engagement | Save-worthy value | Native |
8 | Dwell time | Engagement | Content depth | Premium |
9 | Share / repost rate | Engagement | Network effect | Native |
10 | Reply-to-follow conversion | Conversion | Reply ROI | Manual / tool |
11 | Follower growth velocity | Conversion | Compounding | Native |
12 | Profile CTR | Conversion | Bio match | Native |
13 | Outbound link clicks | Conversion | Funnel handoff | Native |
14 | Revenue per million impressions | Conversion | Monetization | Premium |
Two of those metrics — reply-to-follow conversion and dwell time — are where most accounts under-invest. We'll dig into both later.
For impression mechanics specifically, the deep version of Layer 1 lives in our breakdown of how to get more impressions on X in 2026.
Layer 1: Reach metrics that show distribution health#
Reach metrics answer one question: did the algorithm decide your post deserved a seat in the For You feed?
Impressions per post is still the headline number, but read it as a ceiling, not a goal. The average X post earned 2,711 impressions in 2025, down about 5% from 2,864 the year before. If you're below 1,000 impressions on most posts, you're not getting algorithmic lift — you're showing to your followers and stopping there.
Reach (unique users) is the Premium-only cousin of impressions. The same person seeing your post twice counts as two impressions but one reach. A high impressions-to-reach ratio (above 1.4×) means your post is getting served back to people who already saw it — usually because dwell time was high.
View-to-follower ratio is calculated, not displayed. Divide views by follower count. A ratio over 1.0 means your post reached more people than follow you — the For You feed picked it up. Sub-10K accounts should aim for 2–5× on their best posts. If every post lands at 0.3×, the algorithm has decided you're follower-only.
Profile visit ratio is profile visits divided by impressions. Healthy is 0.5–2%. Lower means your post earned attention but your name or hook didn't earn a tap. That's a profile problem, not a content problem.
Layer 2: Engagement metrics the algorithm actually rewards#
Engagement metrics are where the new ranking model shows up most clearly. The last weights X published — in the ranking code it open-sourced in 2023 — show how lopsided the scoring is. The current Grok-based model's weights aren't public, but the published ones are the best evidence of what the system values.
Predicted action | Published weight (2023) | What it tells you |
|---|---|---|
Reply the author engages with | 75 | Conversation the author validated |
Reply | 13.5 | Strong intent to talk |
Profile click, then like or reply | 12 | Your name earned a tap |
Click into the conversation and engage | 11 | The thread pulled them in |
Click in and stay 2+ minutes | 10 | Content held attention |
Repost | 1 | Network endorsement |
Like | 0.5 | Passive acknowledgement |
Negative feedback (show less, mute, block) | -74 | Actively hurts distribution |
Report | -369 | Near-fatal for the post |
Weights from the open-sourced Home Mixer ranking config. They're a 2023 snapshot, not today's exact numbers.

The takeaway: if you're chasing likes, you're chasing the lowest-weighted action on the platform. The deeper context lives in our breakdown of the 2026 X algorithm.
Engagement rate is still worth tracking, but as a relative signal — your account against itself, week over week. Cross-account comparisons are misleading because Premium-boosted distribution moves the denominator.
Reply rate (replies divided by impressions) is the single most actionable engagement metric in 2026. A 1% reply rate on a 5,000-impression post is a stronger growth signal than a 5% like rate. Replies pull the algorithm's biggest weight.
Bookmark rate is the closest thing X has to a save-worthy index. The private "personal hub" rolled out in 2025 made bookmarks more private. Bookmarks aren't in the 2023 published weights, so read bookmark rate as a sign of value to readers rather than a known ranking lever. If your bookmark rate is above 0.5%, your content is being treated as reference material.
Dwell time matters too: the 2023 config already rewarded people who clicked into a conversation and stayed at least two minutes. Posts that hold attention outlast quick-scroll content.
Share rate (reposts ÷ impressions) is the network-effect metric. Anything over 0.3% pushes your post into second-degree feeds.
Layer 3: Conversion metrics that translate engagement into outcomes#
Layer 3 is where strategy meets accounting. These are the metrics that translate Layer 1 and 2 into followers, signups, and revenue.
Reply to follow conversion is the most under-tracked metric on X. It measures how many new followers you earn per 100 replies you ship. It's not on the native dashboard — you calculate it weekly. There's no published benchmark for it, so measure your own baseline for a month and treat a falling number as a sign your reply quality or targeting is off.
Follower growth velocity is followers gained per week, not total followers. A 1,500-follower account adding 50/week is on a steeper trajectory than a 15,000-follower account adding 100/week.
Profile CTR is profile visits divided by impressions — same number as in Layer 1, but read here as a conversion signal. Going up means your name + hook combination is doing the qualification work for free.
Outbound link clicks are still the cleanest funnel handoff. The catch: link-in-body posts lose an estimated 30–50% of initial reach. The 2026 workaround is to put the link in reply #1 of your own post. Track clicks in the destination tool (UTMs in Plausible, Fathom, or GA4), not on X.
Revenue per million impressions (RPM) is the new monetization north star. Because payouts now come from a Premium subscription pool rather than ad share, only impressions from verified users count toward what you earn — so two posts with identical impression counts can pay wildly differently depending on who saw them. X publishes the current terms on its creator revenue sharing page; check them there rather than trusting a third-party figure, since the pool math has been revised more than once. RPM is what tells you whether Premium investment pays.
What's a good engagement rate on X in 2026?#
Benchmarks for engagement rate X 2026 shift sharply by follower tier — and the platform median is much lower than most guides admit.
Follower tier | Median engagement rate | Top 10% engagement rate | Realistic target |
|---|---|---|---|
Under 1K | 1.8% | 4.5% | 2% sustained |
1K–10K | 1.2% | 3.0% | 1.5% sustained |
10K–100K | 0.6% | 1.8% | 1% sustained |
100K–1M | 0.3% | 0.9% | 0.5% sustained |
1M+ | 0.1% | 0.4% | 0.2% sustained |
These tiers are working targets, not a published dataset. Use them as a starting point and replace them with your own 4-week rolling average as soon as you have one.
The pattern: engagement rate falls as accounts scale. A 0.5% rate on a 100K account is the same predictive signal as a 1.5% rate on a 5K account. ```image:chart alt="Bar chart of working engagement-rate targets on X by follower tier, falling from 1.8 percent under 1K followers to 0.1 percent above 1 million followers" {"type":"bar","data":{"labels":["Under 1K","1K-10K","10K-100K","100K-1M","1M+"],"datasets":[{"label":"Working median target (%)","data":[1.8,1.2,0.6,0.3,0.1],"backgroundColor":"#1d9bf0"}]},"options":{"plugins":{"legend":{"display":false},"title":{"display":true,"text":"Engagement rate falls as accounts grow (working targets)"}},"scales":{"y":{"beginAtZero":true,"title":{"display":true,"text":"Engagement rate (%)"}}}}}
Don't compare yourself to creators a tier above or below — and don't trust generic "what's a good engagement rate" articles that quote a single number.

For the formula, when to recalculate, and how to handle reply-heavy accounts where engagement happens off your own post, read the longer [X engagement rate guide for 2026](https://reachmore.co/blogs/twitter-x-engagement-rate-guide-2026).

## The reply-to-follow conversion metric nobody tracks

Here's the contrarian take that runs against every X analytics 2026 guide currently ranking on Google: engagement rate is now a backward-looking vanity metric. Reply-to-follow conversion is the leading indicator that actually predicts growth.

The reason is structural. When you reply on a 50,000-follower account's post, your engagement shows up under *their* impressions — not yours. Your engagement rate stays flat. Your reach explodes. The native dashboard is bad at this exact scenario, which is the most common growth tactic on X in 2026.

For reply-led growth, the ratio that predicts breakout is **new followers earned per 100 replies shipped**.

To track it, you need three numbers each week:

- Total replies posted

- New followers gained

- Replies that came from accounts above your tier (where the algorithm leverage lives)

Divide new followers by replies, multiplied by 100. There's no industry benchmark for reply-to-follow conversion, so your own trend is the benchmark. If it falls, you're either replying on accounts too small to lift you or shipping replies that don't earn the tap-through.

Worth being precise about what tooling can and can't do here. The replies that drive this metric — the ones you leave on other people's posts — have to be written by you. X's API has no endpoint for creating a reply to someone who didn't mention or quote you, so no compliant tool will ship those on your behalf, and the ones that claim to are automating a browser session against the rules. What software can carry is the surrounding load: drafting your own posts, holding your cadence, and clearing the mentions your replies eventually generate. See [what X actually allows for auto replies](https://reachmore.co/blogs/auto-reply-twitter-2026) for the full boundary.

> **Clear the mentions your replies earn →** [Open ReachMore](https://reachmore.co){cta=signup} — it drafts a response to each mention and holds it until you approve.

For the upstream half of this loop — picking which tweets are even worth replying to — see [how to find tweets to reply to on X](https://reachmore.co/blogs/how-to-find-tweets-to-reply-to-on-x).

## Dwell time and 30-minute velocity beat follower count

The second 2026 contrarian: follower count is officially decoupled from reach. The variables that actually predict the next 30 days are **average dwell seconds per impression** and **first-30-minute engagement velocity**.

Follower count doesn't appear among the published engagement weights — predicted engagement does. A 500-follower account that holds attention for four seconds per impression in the first half-hour can out-reach a 50,000-follower account that gets scroll-past likes.

Justin Welsh's essay "[How I Added 44,716 Twitter Followers in 18 Weeks](https://justinwelsh.me/essays/how-i-added-44-716-twitter-followers-in-18-weeks)" is a useful public example of the same idea: consistent habits around replies and threads rather than chasing one viral post. Read it for his process. The analytics lesson is to track the inputs you control, not just the follower total.

For the velocity side, watch your first-30-minute engagement rate as a separate number. Pull impressions and engagement counts at the 30-minute mark and again at 24 hours. If 30-minute engagement is over 40% of 24-hour engagement, your post hit the For You feed. If it's under 15%, the algorithm capped distribution early and you're showing to followers only.

## The 40-minute Sunday X analytics 2026 review (copy-paste checklist)

Most accounts overcomplicate analytics by checking the dashboard daily and chasing noise. A 40-minute weekly review beats a 5-minute daily scroll every time. Copy this checklist into your weekly planner.

```image:mermaid alt="Vertical flowchart of the 40-minute weekly X analytics review: ten minutes on reach, ten on engagement, ten on conversion, and ten planning next week"
flowchart TB
  A["Block 1: Reach - 10 min<br/>median impressions, view-to-follower"] --> B["Block 2: Engagement - 10 min<br/>reply rate, bookmarks"]
  B --> C["Block 3: Conversion - 10 min<br/>reply-to-follow, follower velocity"]
  C --> D["Block 4: Plan - 10 min<br/>formats, accounts, reply target"]
Block 1 — Reach (10 minutes)
Pull impressions per post for the last 7 days. Note the median, not the average — outliers lie.
Calculate view-to-follower ratio for your top 3 and bottom 3 posts. Flag any post over 2× as a hook to replicate.
Note profile visit ratio. If below 0.5%, your hook or pinned tweet needs work.
Block 2 — Engagement (10 minutes)
Reply rate per post (replies ÷ impressions). Anything over 1% is a strong post.
Bookmark rate on your top 5 posts. Above 0.5% means save-worthy — turn it into a thread.
Dwell time on your top and bottom posts (Premium). Identify which formats hold attention.
Block 3 — Conversion (10 minutes)
Calculate reply-to-follow conversion: new followers this week ÷ total replies shipped × 100.
Follower growth velocity: net new followers / 7. Compare to last 4 weeks' rolling average.
Outbound link clicks: pull from your destination tool. Cross-check against any link-in-reply posts.
Block 4 — Plan the next week (10 minutes)
Pick the top-performing format and commit to 2 more posts in it.
Identify 5 peer-tier or above-tier accounts you'll reply to consistently this week.
Set a reply target. The math from our how many replies per day on X breakdown holds in 2026.
The one number to write down manually is replies shipped — nothing reports it for you, and it's the denominator for the metric that matters most. Keep a tally in the same sheet as the rest. The Sunday review then becomes a measurement of what actually shipped, not what you wish you'd shipped.
What to do when X impressions drop suddenly#
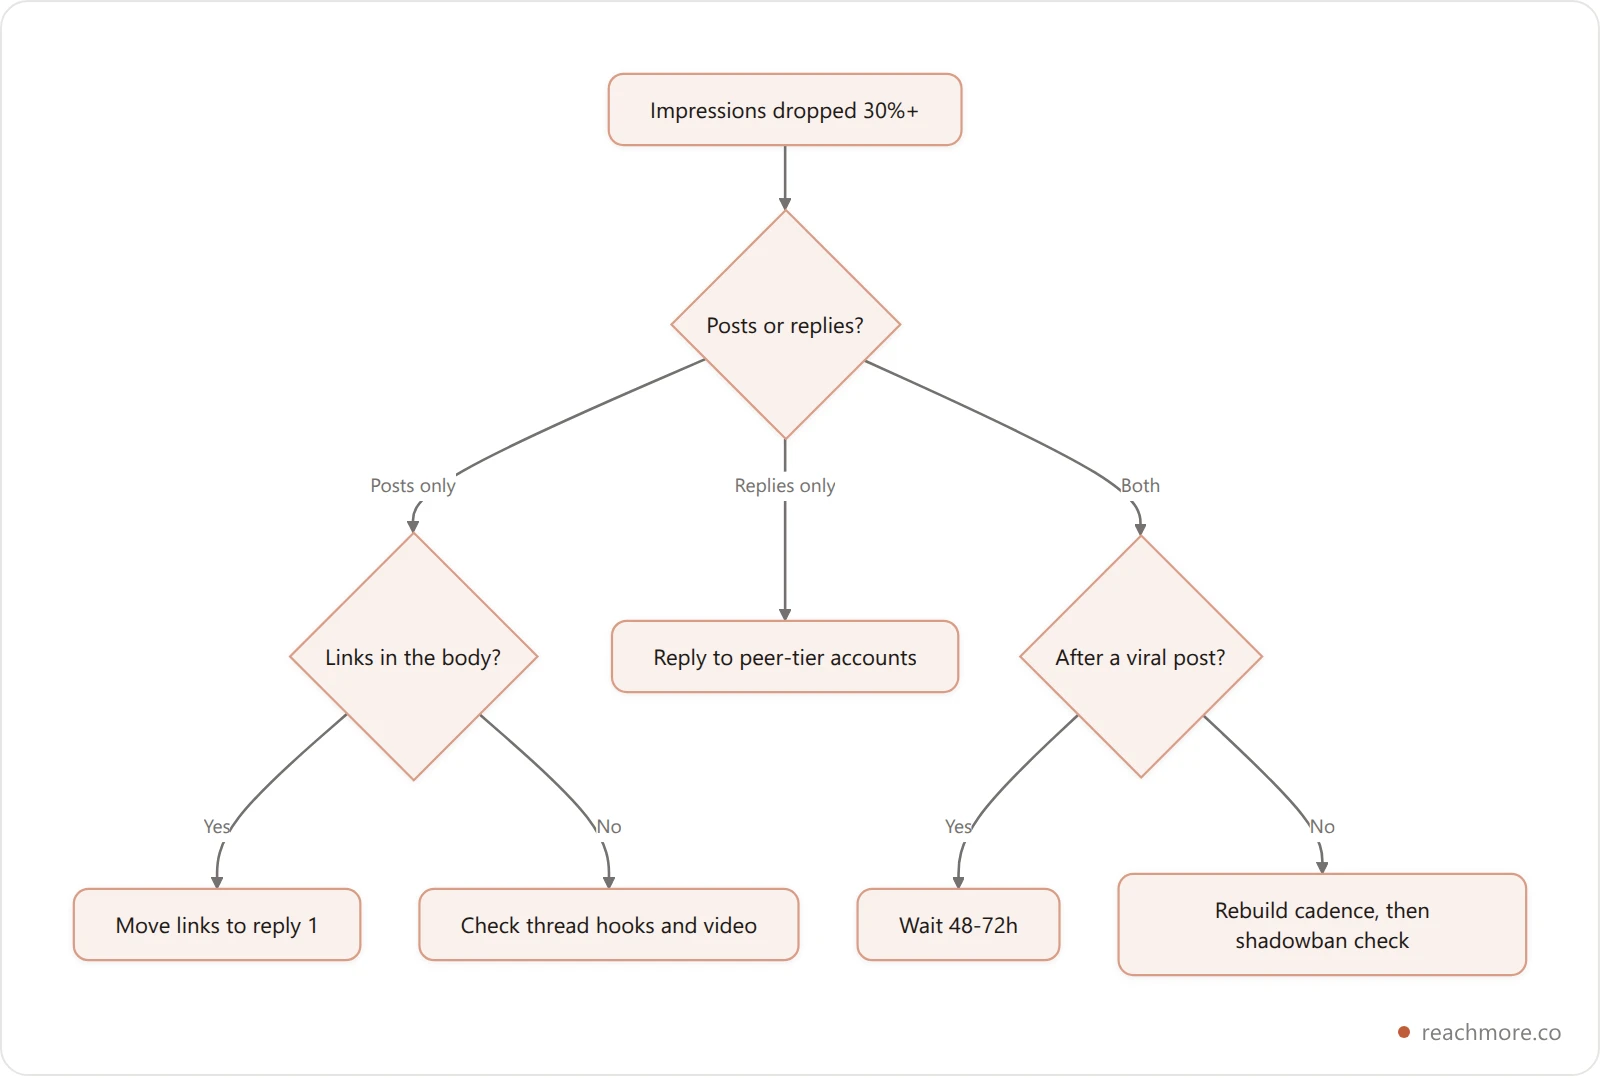
A sudden 30–50% drop in impressions is the single most common panic moment on X. The dashboard doesn't tell you why. The diagnostic does.
Symptom | Likely cause | Fix |
|---|---|---|
All posts dropped, replies fine | External-link penalty | Move links to reply #1 |
Replies dropped, posts fine | Tier shift — replying too low | Move replies to peer/above-tier |
Both dropped after a quiet week | Velocity decay | Post 2× daily for 7 days |
Both dropped after a viral post | Anti-spam throttle | Stay normal; resolves in 48–72h |
Dropped after thread | Thread-completion low | Tighten hook + post 1 |
Dropped only on video | Codec/upload issue | Re-upload in 1080p, 30fps |
Total impression collapse, dashboard shows 0 | Shadowban suspected | Run a shadowban check |
Keep a drop in perspective. A drop in raw impressions matters less than what happened to reply quality, profile CTR, and follower velocity in the same window. If the leading indicators held, the dashboard will catch up.
Frequently Asked Questions#
How do I check my X analytics for free in 2026?#
Free accounts still get basic per-post analytics — impressions, engagements, profile visits, link clicks — by tapping the bar-chart icon under any of your own posts. Account-level summary, reach (unique users), and dwell time are Premium-gated. For a free baseline, scrape your own posts weekly into a spreadsheet and calculate the calculated metrics (view-to-follower ratio, reply rate, profile CTR) yourself.
What is a good engagement rate on X in 2026?#
Platform median sits around 0.10%, per Hootsuite's 2026 benchmarks, but tier matters. Under 1K followers, target 1.5–2% sustained. Between 10K and 100K, target 0.8–1%. Above 100K, anything above 0.3% is above-median. Compare yourself only to your own 4-week rolling average — cross-account comparisons mislead because Premium-boosted distribution shifts the denominator.
Why did my X impressions drop in 2026?#
Most sudden drops trace to one of six causes: external-link penalty (~30–50% reach reduction), tier-mismatch replies, velocity decay after a quiet week, post-viral throttle, low thread completion, or a video upload issue. Run the diagnostic table above. If all six pass and you've lost ~80%+ of impressions, run a shadowban check.
Does X Premium increase reach?#
Yes, measurably. Premium accounts show roughly 4× the median engagement of free accounts in Hootsuite's 2026 benchmarks, but the lift is not automatic — Premium amplifies whatever content quality and reply velocity you already have. If your free-tier baseline is weak, Premium won't fix it. Our Is X Premium worth it in 2026 breakdown does the creator math.
Are bookmarks more valuable than likes on X?#
Probably, though X has never published a bookmark weight. A bookmark signals "save-worthy" and predicts future reach because the algorithm reads it as a strong endorsement. Track bookmark rate (bookmarks ÷ impressions) as a primary engagement metric. Above 0.5% means your content is being treated as reference material.
How do I track reply performance on X?#
The native dashboard shows replies-received but not replies-shipped. Track three numbers manually each week: total replies you sent, new followers gained, and replies that came from accounts within or above your follower tier. Divide new followers by total replies × 100 for your reply-to-follow conversion rate, and compare it with your own previous weeks.
What's the difference between views and impressions on X?#
Views count every time the post appears on a screen — including the same person scrolling past twice. Impressions count the same way for posts but the term is sometimes used interchangeably with "viewed for at least 500ms." The 2026 dashboard standardized on impressions for posts and views for video. Reach (unique users) is the cleaner number, but it's Premium-only.
How many followers do you need to get monetized on X in 2026?#
The creator revenue sharing program requires an active Premium subscription plus follower and impression thresholds that X has revised more than once. Check the current numbers on X's creator revenue sharing page rather than trusting a figure quoted elsewhere. What doesn't change: verified-user impressions are what pays, not raw impressions.
Key takeaways#
Three numbers do most of the work. View-to-follower ratio tells you whether the algorithm is letting you out of your follower bubble. Reply-to-follow conversion tells you whether the replies you ship are earning followers. Dwell time tells you whether the impressions you earn are actually catching attention. Track them weekly, weight them in that order, and most of the rest of the dashboard becomes noise you can safely ignore.
The 14-metric stack above is the full picture. The 3-Layer Growth Stack is the framework for reading them. The Sunday review is the habit that makes both useful. Skip the daily check-in — it's the single biggest time sink in X analytics 2026 and almost none of the resulting decisions are good ones.
If reply-led growth is your main channel, the measurement loop only works if the rest of the account isn't eating the hours the replies need. Open ReachMore → — composer, scheduler, and a mention queue that drafts and waits for your approval, on a credit wallet you top up once.
Knowing which metrics matter is half the job — the other half is picking something to read them in. Our ranked guide to Twitter analytics tools compares 7 options on what each can actually see, why your numbers are always a few hours stale, and which claims about competitor data don't hold up.